In November of 2020, the Arlington area experienced a tornado that caused damage to homes and buildings. We were brought in by a Dallas-based engineering firm representing the insurance carrier to perform a moisture survey on the two buildings that were claimed to be damaged from the storm.
The engineering firm that we partnered with represents insurance carriers nationwide. We have enjoyed working with this firm because they are truly dedicated to providing the data necessary to solving claims.
Prior to us conducting our onsite inspection, the engineering firm had already taken core samples of the roof. The roof’s known construction was comprised of an old tar and gravel built-up roof with a half inch of foam installation and TPO on top.
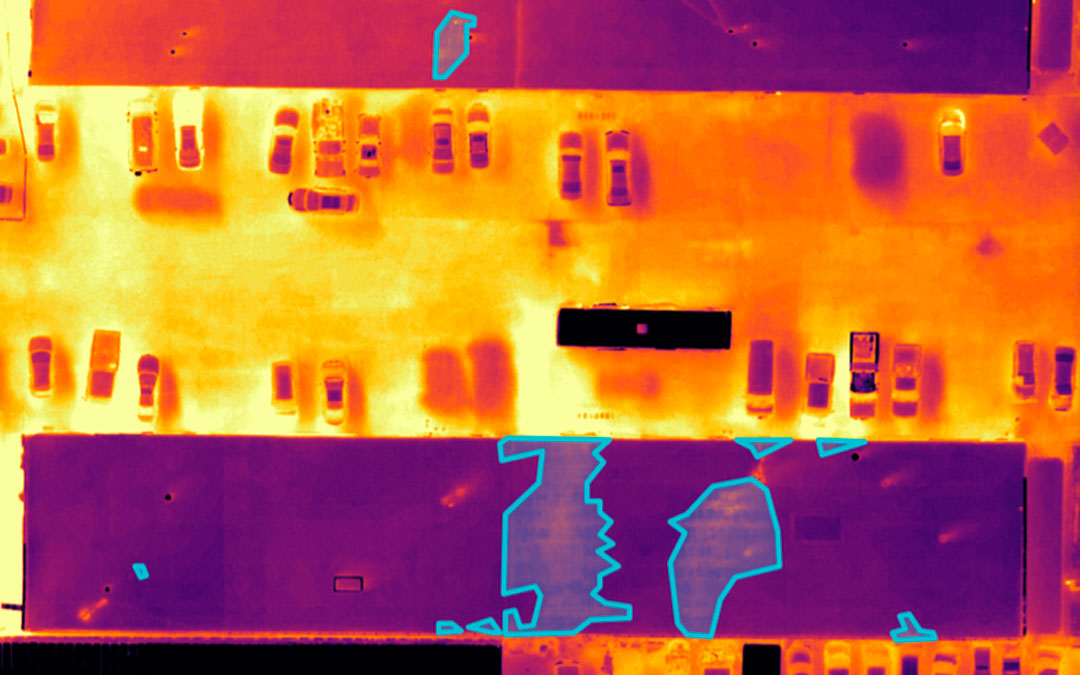
On the day we went out, the weather conditions were favorable with clear skies, which allowed us to obtain accurate and detailed drone footage. Through the use of non-destructive thermal surveying and Tramex moisture meter scans, we were able to identify multiple areas of suspected moisture on both roofs, which the engineering firm and insurance provider will be able to use to help settle the claims. Each of the two buildings had roofs that were approximately 10,000 sq. feet. The first roof had approximately 80 sq. feet of suspected moisture, while the second roof had about 1,400 sq. feet of suspected moisture.
It should also be noted that the tornado’s trajectory affected the southern ends of the roofs the most, which is why there was significant wind damage found on the southern side of each of the roofs surveyed. Because the wind-damaged parts of the roof were left open for so long after the storm, the moisture damage had the chance to dry up significantly, which is the reason that there wasn’t a large area of suspected moisture on the southern end of the first roof.
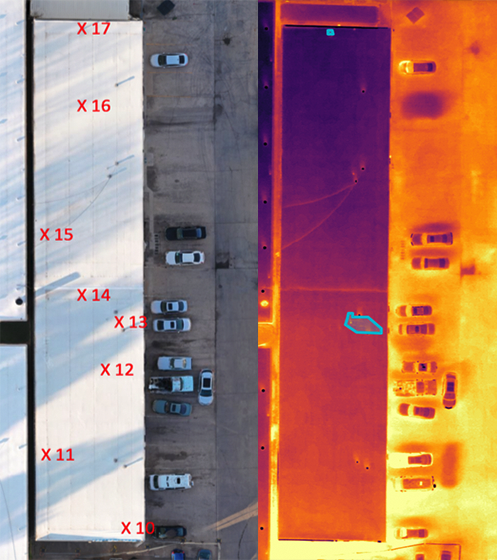
On the first roof, we identified two areas of potential moisture with the thermal imaging, which added up to 83 sq. feet. However, once we conducted the Tramex moisture meter scan, we found that there were many more areas of potential moisture. Because we did not identify openings in the membrane in many of the areas where moisture was detected with the moisture meter, we came to the conclusion that a lot of that moisture damage was preexisting to the installation of the foam insulation and TPO. In the areas that we did not initially suspect damage when studying the thermal images, but then found to be damaged when we used the Tramex moisture meter, we concluded they were actually caused by failed TPO welds, not storm damage. The reason we believe that we were unable to detect some of these temperature readings in the thermal scans is because the moisture was getting into the old built-up roof. This was causing the minute temperature changes to be insulated by the above foam insulation and TPO. The differences in the results of the non-destructive thermal images and the Tramex scans can be seen below.
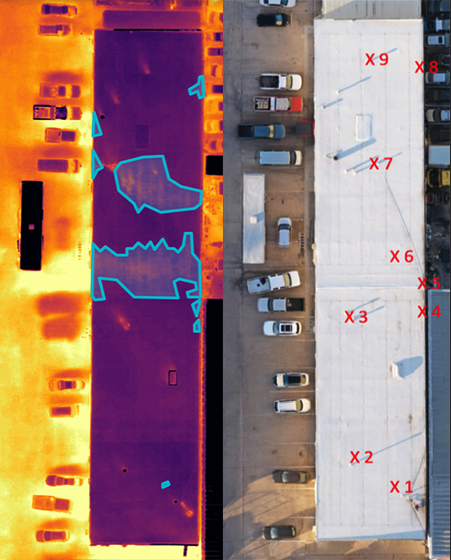
On the second roof, there was a much higher percentage of moisture damage — about 10% of the total square footage, whereas the first roof’s moisture damage was less than 1% of the total square footage. The thermal images that we captured detected two areas of significant moisture damage, which matched our Tramex scan.
The collective use of non-destructive thermal imaging and the Tramex moisture meter scan provided sufficient information for us to create a clear and comprehensive report for the engineering firm and their insurance carrier client.
