Client Challenge
The two roof systems surveyed are part of a large commercial facility that includes a total of nine main roof sections. These two roof systems have numerous issues, including leaks and internal moisture. The contractor needs to assess the condition of these roofs to determine possible solutions. Their goal was to understand the current state of the roofs in order to recommend appropriate actions to address the problems.
Roof Data
Location: Ft. Pierce, FL
Type & Purpose of Survey: Roof survey for condition assessment
Section 1, Roof Area: 14,498
Section 1, Moisture Content: Estimated 8,806 Square Feet
Section 1, Percent of Moisture Intrusion: Estimated 61%
Section 7, Roof Area: 14,498
Section 7, Moisture Content: Estimated 3,806 Square Feet
Section 7, Percent of Moisture Intrusion: Estimated 25%
Assessment & Results
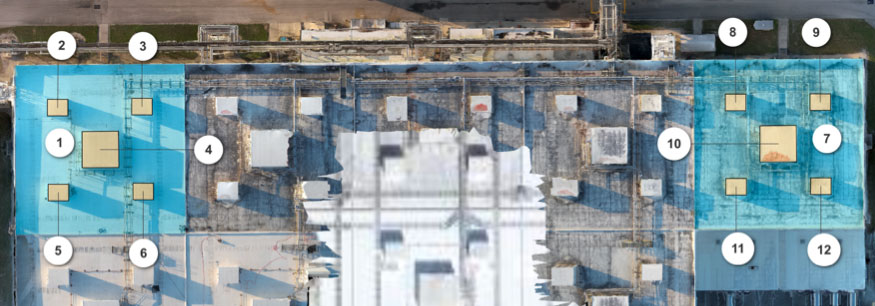
The investigation started with a moisture survey on the roof system. The building has a total of nine connected roof sections, each containing five penthouses. The survey was limited to two of these roof sections along with their penthouses: the Northwest Section 1 and the Northeast Section 7. No other sections of the roof were surveyed. These roof sections are identified in the images further down in this case study.
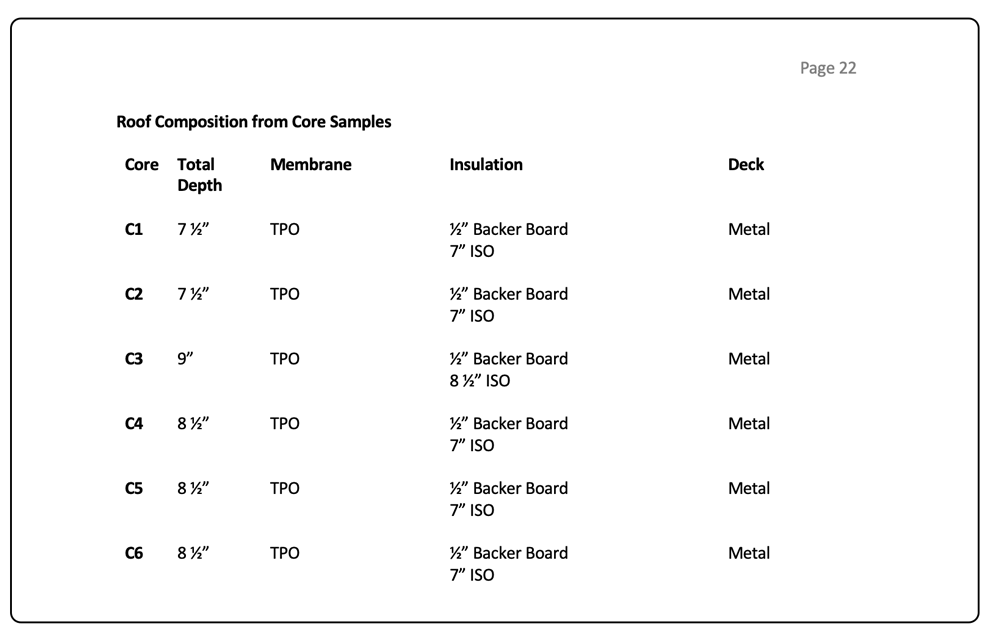
The roof sections are comprised of a TPO membrane over a backer board, ISO insulation, and a metal deck. The main roof sections, 1 and 7, were cored as part of the survey to verify composition. The remaining smaller penthouse sections are assumed to have the same composition as roof sections 1 and 7.
The drone-based thermal scan showed a wide range of thermal signatures throughout the roof system. Based on the RWS electrical resistance scan and core samples, the thermal anomalies were suspected to correlate with moisture in the roof system.
A non-destructive moisture meter test on 55 points using a Tramex RWS Scanner was conducted to document the present condition of the roof system. Core sample locations were strategically selected based on the temperature data in the thermal imagery and the Tramex RWS Scanner electrical resistance scan.
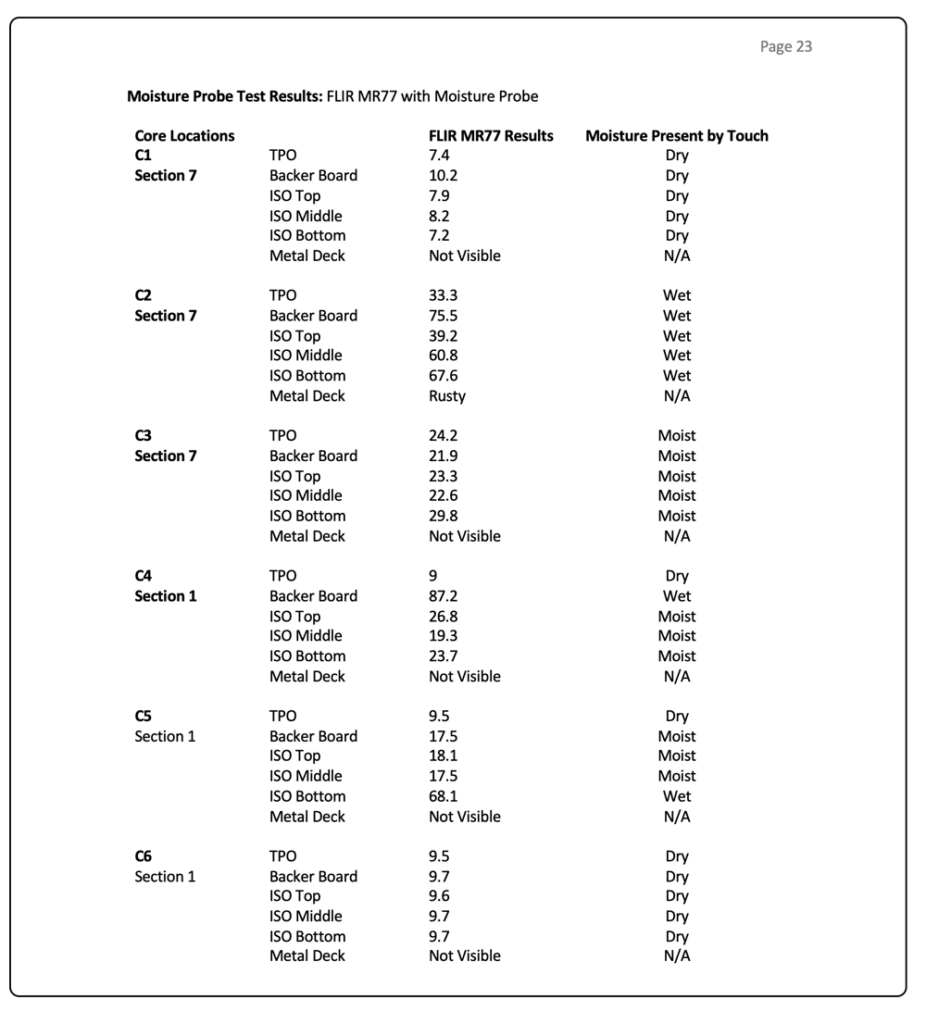
Core samples 1 and 6 reflected dry moisture readings. Core samples 2, 3, and 4 reflected high moisture readings and moisture observed by touch. Core sample 5 reflected slightly elevated moisture readings. The results of the core sample tests can be seen in the images below this case study.
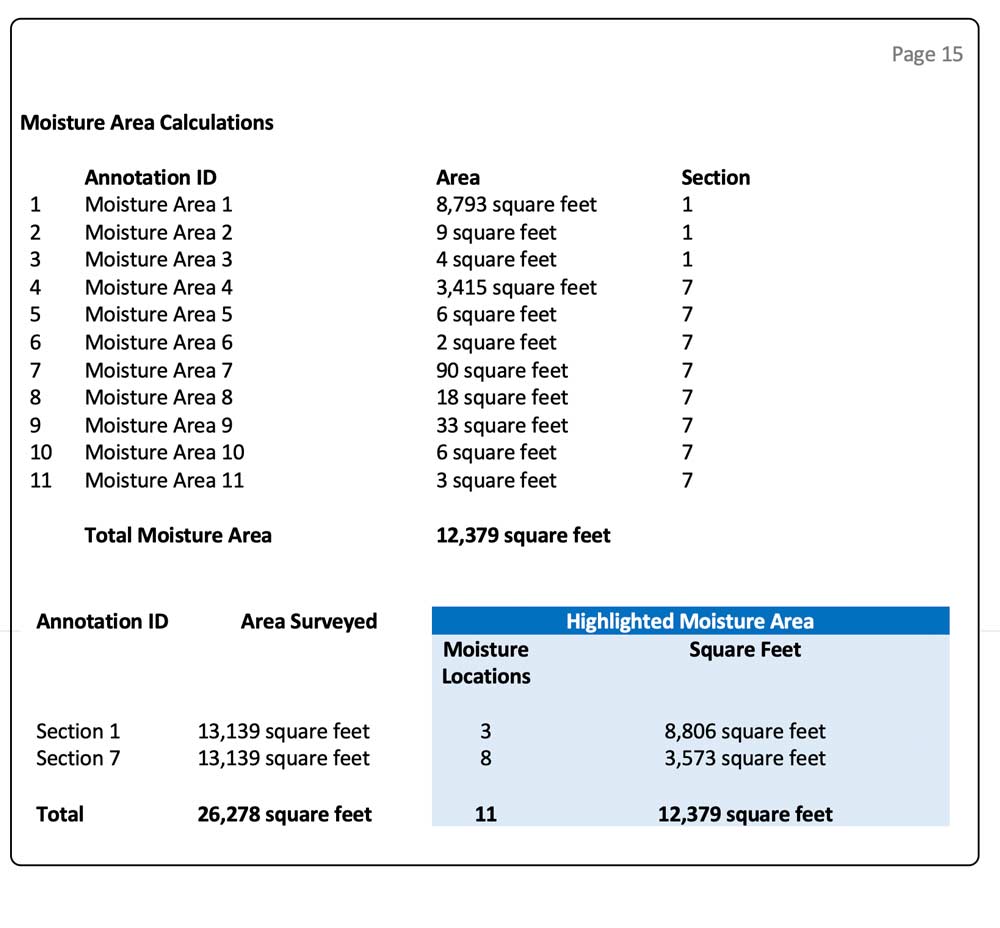
Based on the results from the testing performed, a total of 11 moisture areas have been identified and highlighted in blue throughout the report, totaling approximately 12,379 square feet.
Exploring the Data Insights from the Report: A Deep Dive
The ‘Roof Data Sheet’ graphic below provides an overview of roof construction, core sample data, general roof data, moisture distribution, and other aspects of the roof system.
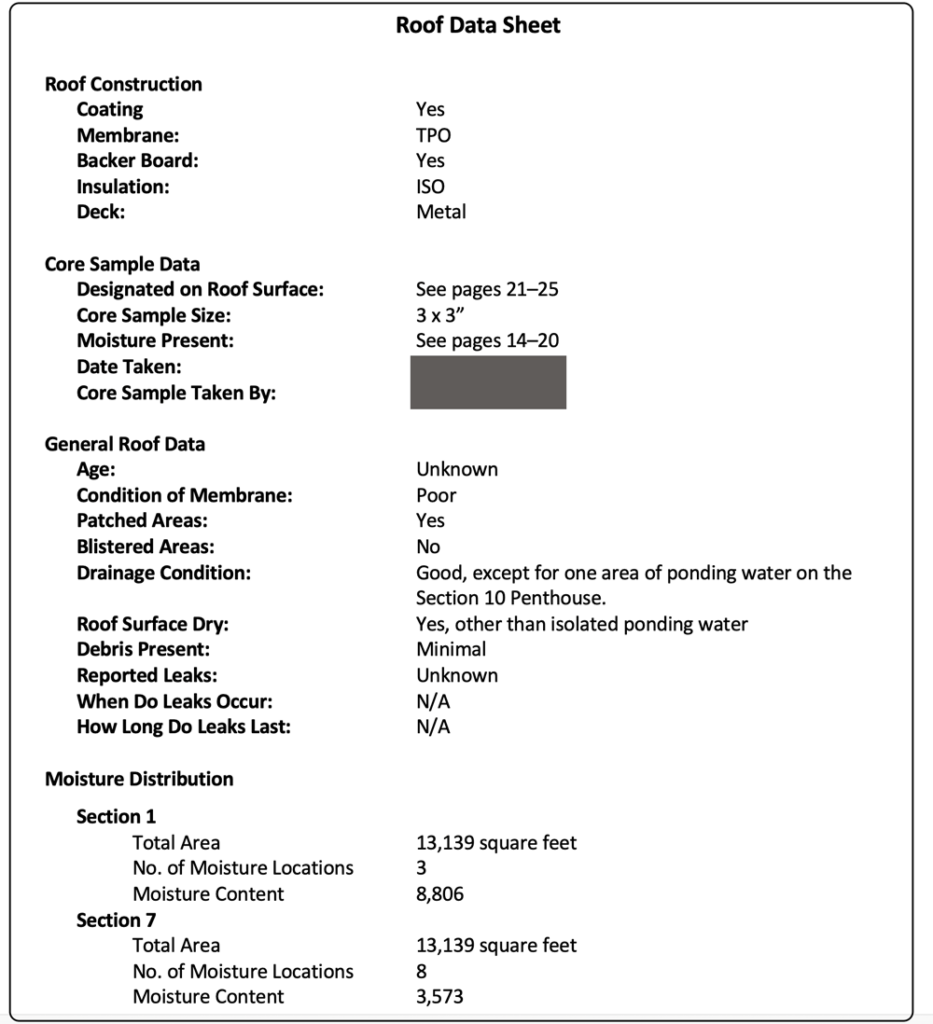
Image Analysis
To thoroughly assess these TPO roofs, we conduct a series of thermal scans after sunset, waiting about an hour between each full scan. These scans are processed to allow us to analyze the evolving heat patterns over time, helping to distinguish between heat signatures associated with moisture, material differences, exposed built-up membranes, heat reflections, and other factors.
After selecting the scan that provides the best visualization of thermal anomalies, we perform several types of analysis, including a composition and thermal image analysis, core sample testing, and electrical resistance scan point data.
The analysis resulted in the following images and data tables:
- Moisture Highlighted Image Sets
- Roof Section Identifications
- Moisture Area Identifications
- Moisture Meter Testing Results
- Roof Composition from Core Samples
- Moisture Probe Test Results
Moisture Highlighted Image Sets
Below, are Image Sets 1 and 3 showing a representative sample of Highlighted Image Sets.
Image Set: 1
Subject Priority: 1
Height: 150’ AGL Stitched
Image Type: Infrared/Visible
Location: Overhead, Roof Sections 1 and 7
Equipment: DJI Matrice 30T
Comments: Highlighted suspected moisture locations are represented on both thermal and visible images below. Three roof sections that were not included in the survey have been obscured.
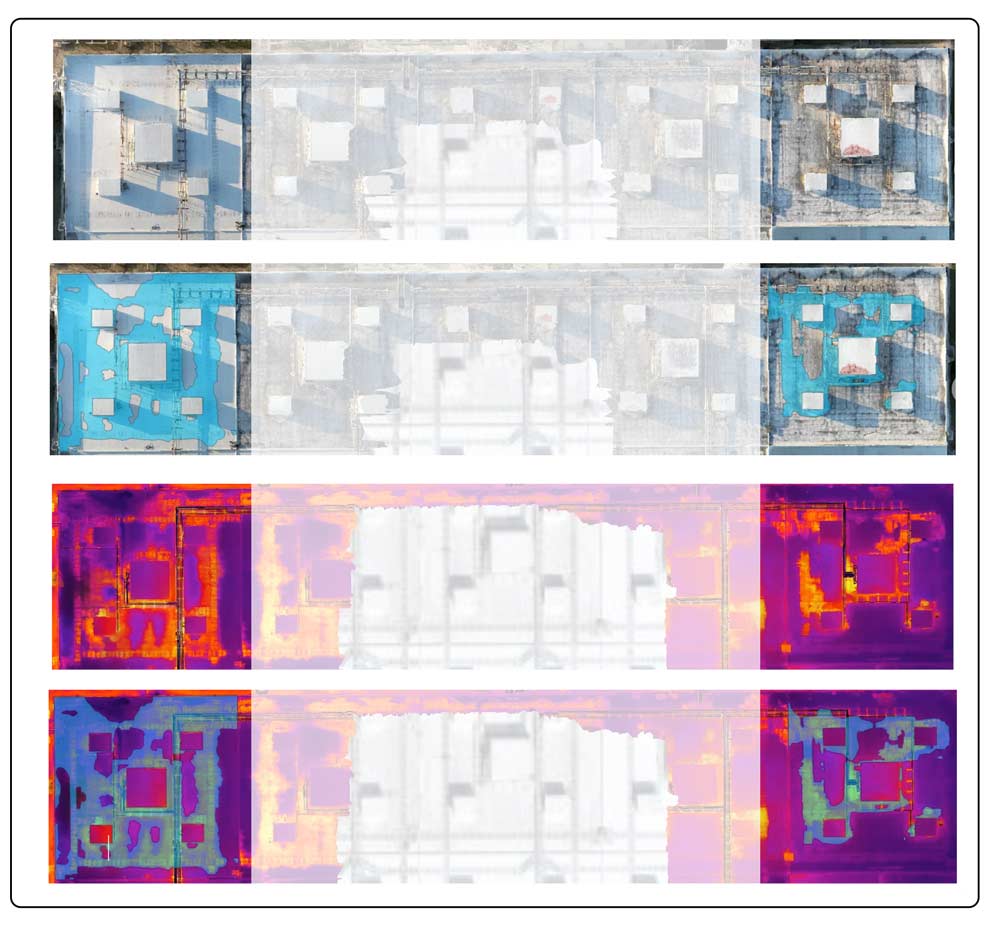
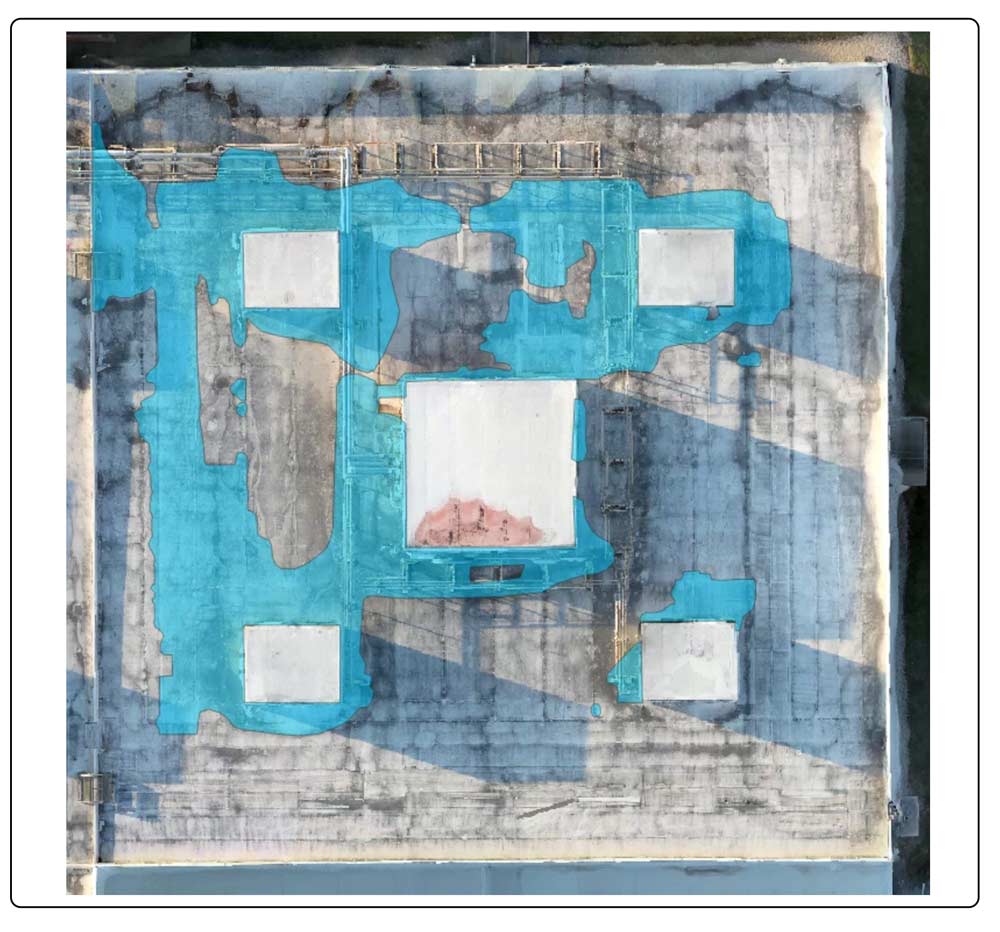
Image Set: 3
Subject Priority: 1
Height: 150’ AGL Stitched
Image Type: Infrared/Visible
Location: Section 7, 8, 9, 10, 11, 12
Equipment: DJI Matrice 30T
Comments: Highlighted suspected moisture locations are represented on the visible image below.
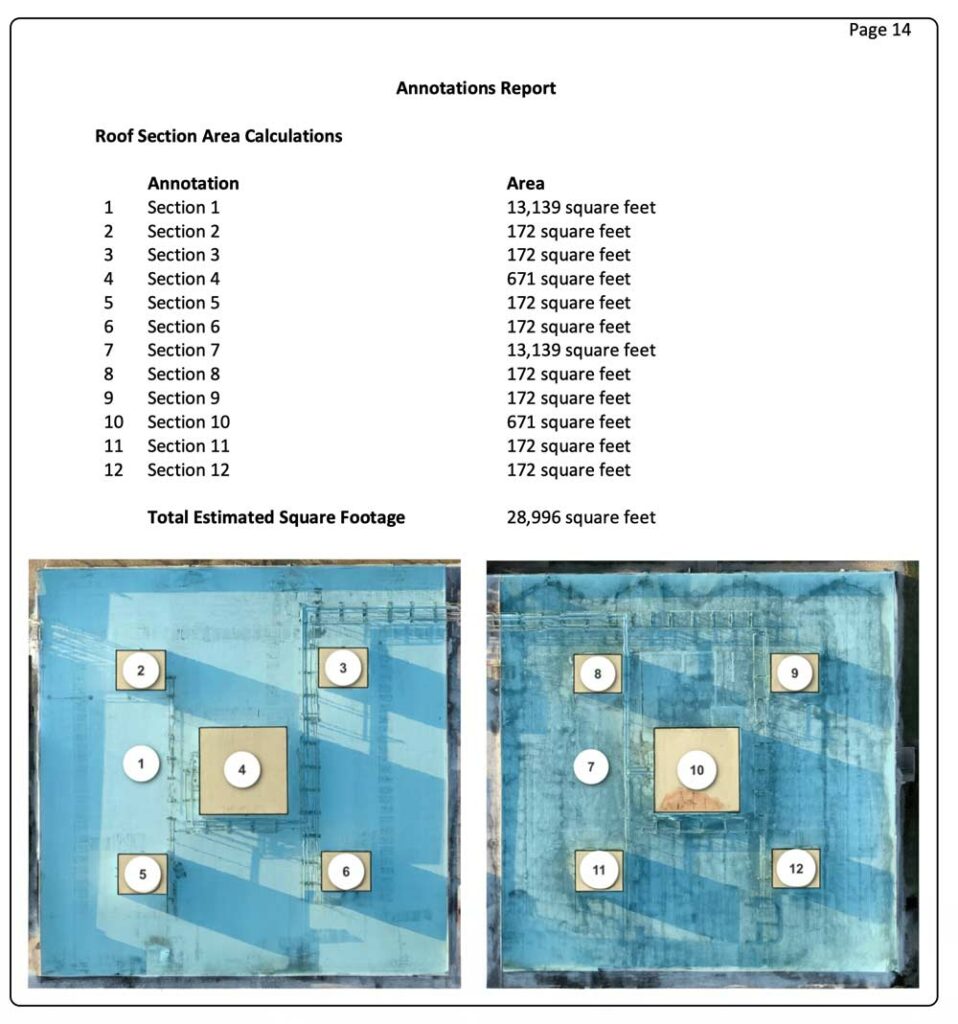
Roof Section Area Calculations
The detailed section of the report begins by identifying the building into sections, each section is assigned a Section ID number, along with showing the corresponding square footage for each section.
Moisture Area Calculations
After identifying the location and area for each section, we provide a comprehensive list of moisture areas. This list includes the Moisture Area ID, square footage of moisture or suspected moisture for each area, and the corresponding section where each moisture area is located.
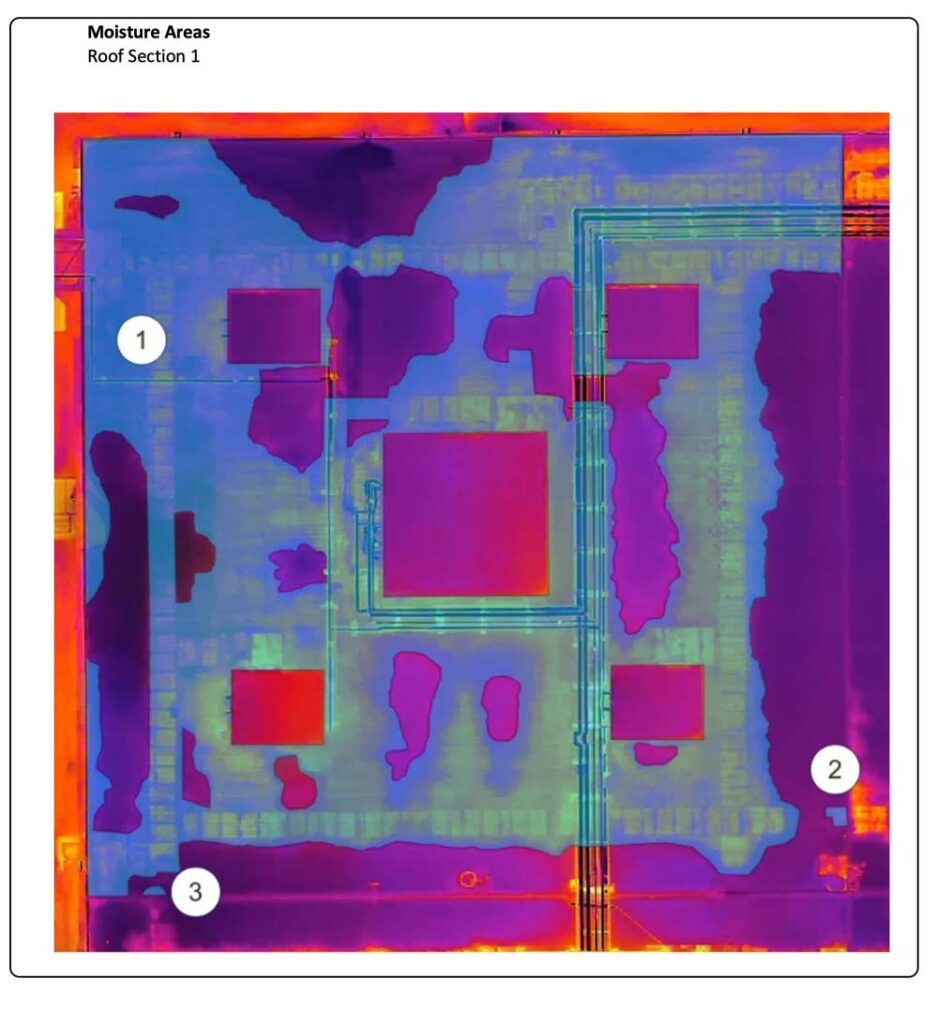
Following the Moisture Area Calculations, detailed graphic representations of the moisture areas are presented.
Please refer to the images below for visual details.
Below is an example of the moisture area map for Roof Section 1.
Moisture Meter Testing Results
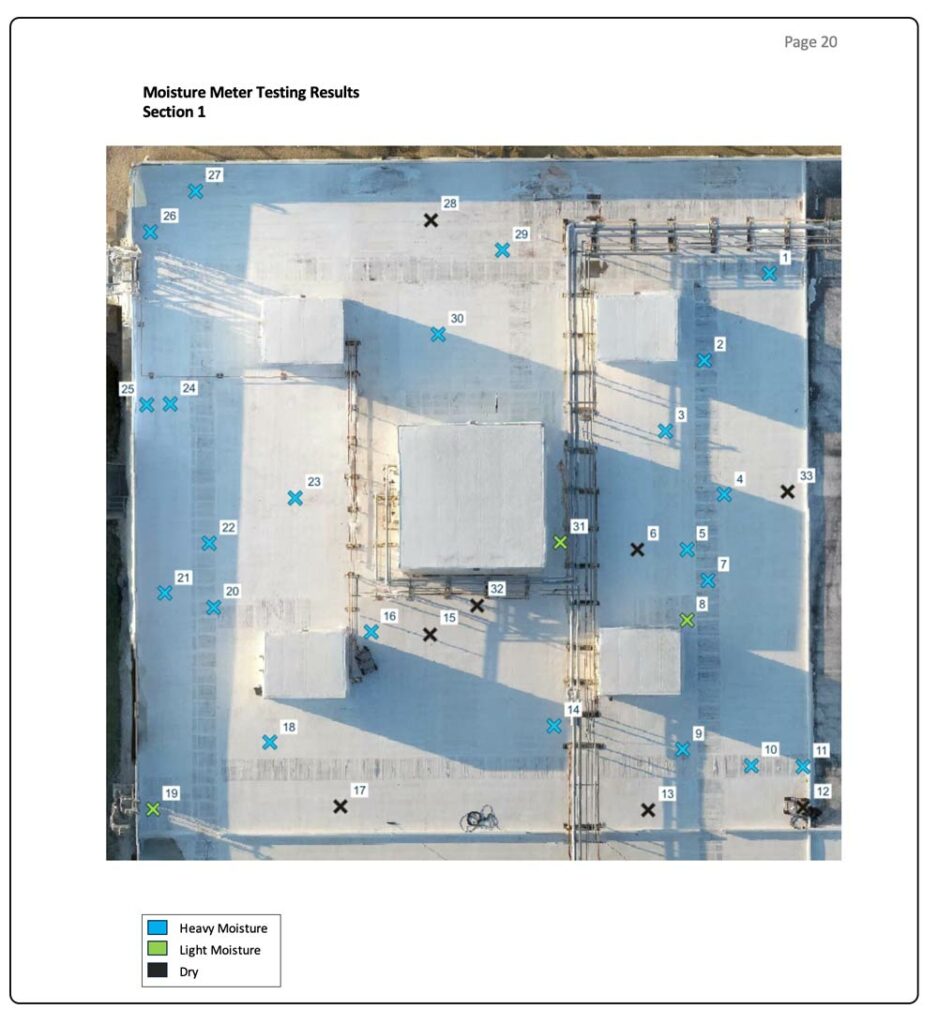
The next section of the report details the moisture values returned by the RWS scanner. This data is used alongside core samples to validate suspected moisture areas identified during the thermal scan. The moisture values range from 0 for dry to 100 representing suspected high moisture levels.
Both a detailed list and corresponding graphic are provided for comprehensive analysis.
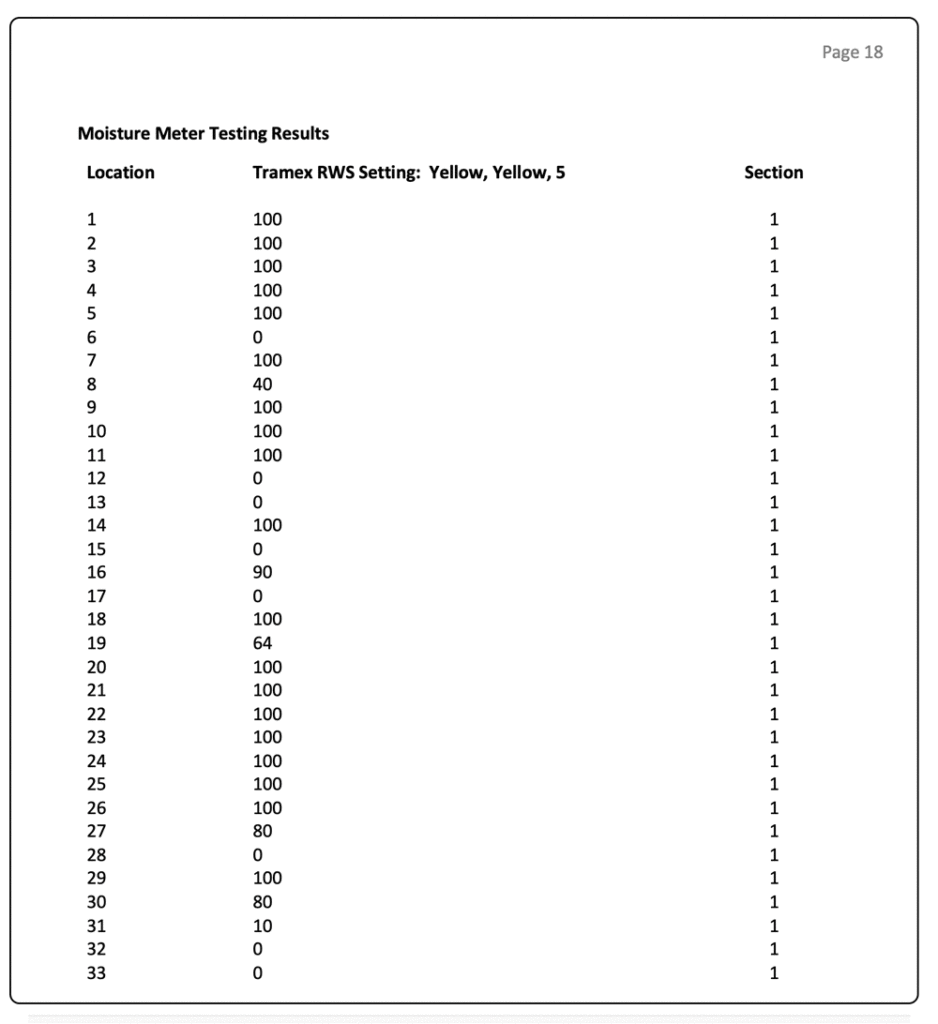
The testing results for the Tramex RWS color-coded scanner points are detailed in this section.
Core Sample: Roof Compositions
Critical to the roof testing process is moisture validation using core samples, which verify both the RWS Scanner results and the thermal images. Below are sample pages illustrating the roof composition and moisture probe tests for each layer of the roof.
Core Sample: Moisture Probe Test Results
Each layer of the core sample is tested for its moisture level.
Visual Overlay of All Moisture Data
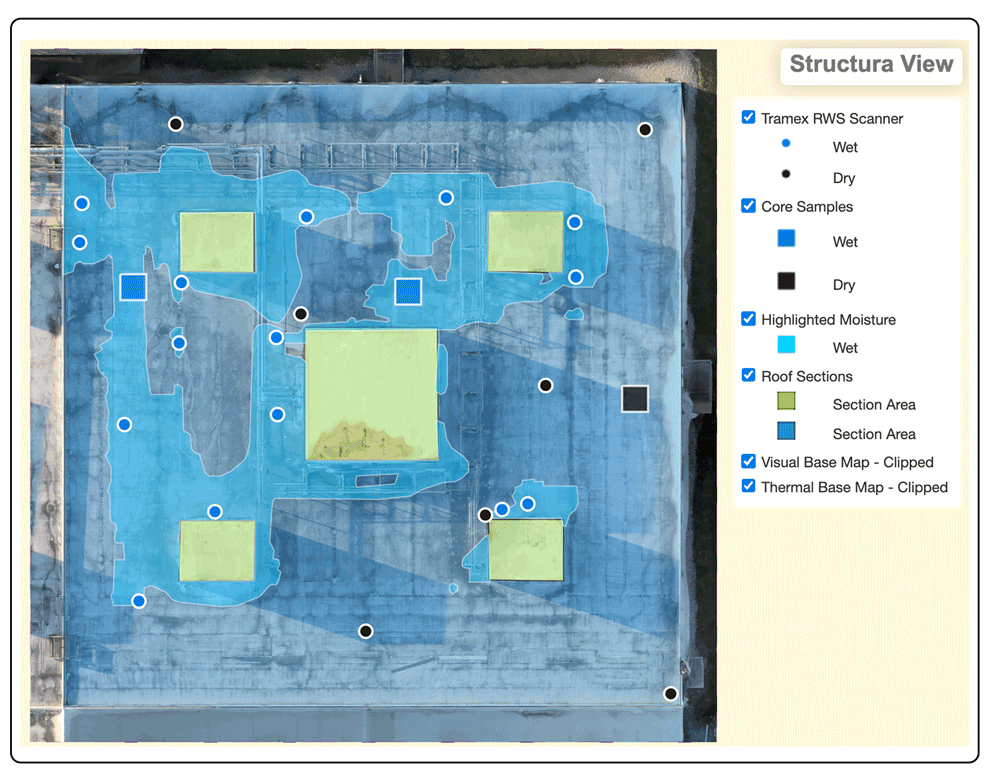
The collected data is digitized into layers, which, when overlaid, provide a comprehensive view of the moisture conditions on the roof. Below is a layered image displaying RWS scanner points, core samples, and highlighted moisture areas based on the thermal scan overlaid onto a visual or thermal image.
To interact with this tool, please use the provided link which will open a new tab in your web browser. You can toggle each layer on and off, view data about each feature by clicking on it to trigger a pop-up window, and utilize tools such as the measure and zoom tools (not shown in the screenshot below) for detailed exploration.
https://structuraview.com/cair
Key Insights and Next Steps
This moisture survey marks the initial phase of the repair process. The data reveals that Roof Section 1 exhibits approximately 61% moisture intrusion, while Roof Section 7 shows an estimated intrusion of 25%.
Moving forward, the contractor will evaluate these findings and determine remediation options tailored to the specific needs of each roof section.
