Client Challenge
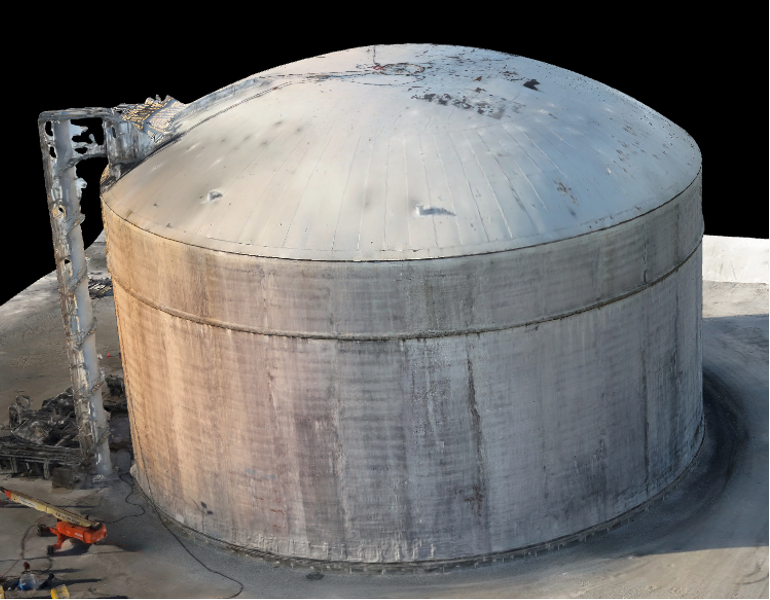
Refrigerated steel shell storage tanks*, commonly used for substances like Propane Liquid Gas (PLG), require stringent temperature and pressure control to maintain their integrity. Over time, the insulation in these tanks can degrade, leading to significant financial losses due to temperature fluctuations. This deterioration can result in increased cooling costs and “breathing loss,” where vapors expand and contract within the tank causing the gas to escape from the tank. It is imperative for our client to monitor insulation integrity to ensure the continued efficiency and reliability of their refrigerated tank systems.
Structura View conducted a survey of the tank’s spray foam exterior coating insulation two years ago when it was a 22-year-old tank. The initial assessment revealed some signs of insulation degradation, prompting the client to monitor the progression of deterioration over time. Concerned about the potential impact on operational efficiency and maintenance costs, the client sought a follow-up study to understand the extent of insulation deterioration across the tank’s exterior surface. This data would be crucial for implementing timely maintenance measures and optimizing the performance of their refrigerated tank systems.
*Read More About Refrigerated Storage Tanks, Storage Tank Insulation
Tank Data
Location: Tampa Bay Area, Florida
Thermal Anomalies Area: Estimated 15,934 square feet
Increase in Anomalies from 2022: 8%
Thermal Anomalies: 48
Tank Composition: Steel shell with spray foam exterior coating insulation
Solution Strategy
This year’s study started with a visual aerial scan during the day and a thermal scan during the optimal evening hours. Various areas in the RGB imagery showed exposed foam, rust, staining, or discoloration. Given the sub-freezing contents stored within, anomalies of concern were expected to register as cold during the thermal scan.
The technical report given to the client highlighted 48 large or contiguous areas displaying cold anomalies which are suspected to be caused from deterioration of the spray foam surface insulation.
The total estimated square footage of these anomalies amounted to 15,934 square feet, calculated based on known tank dimensions and outlined anomalies. This year’s findings represent an 8% increase in surface area anomalies compared to the previous survey.
Our approach to the project began with dividing the tank into 19 vertical sections, aided by a top-down aerial image and identify significant defects from the thermal imaging.

Given the sub-freezing storage temperature of the tank’s contents, the thermal scan was performed at night, with the anomalies registering as cold areas, appearing as dark purple spots in the thermal imagery.
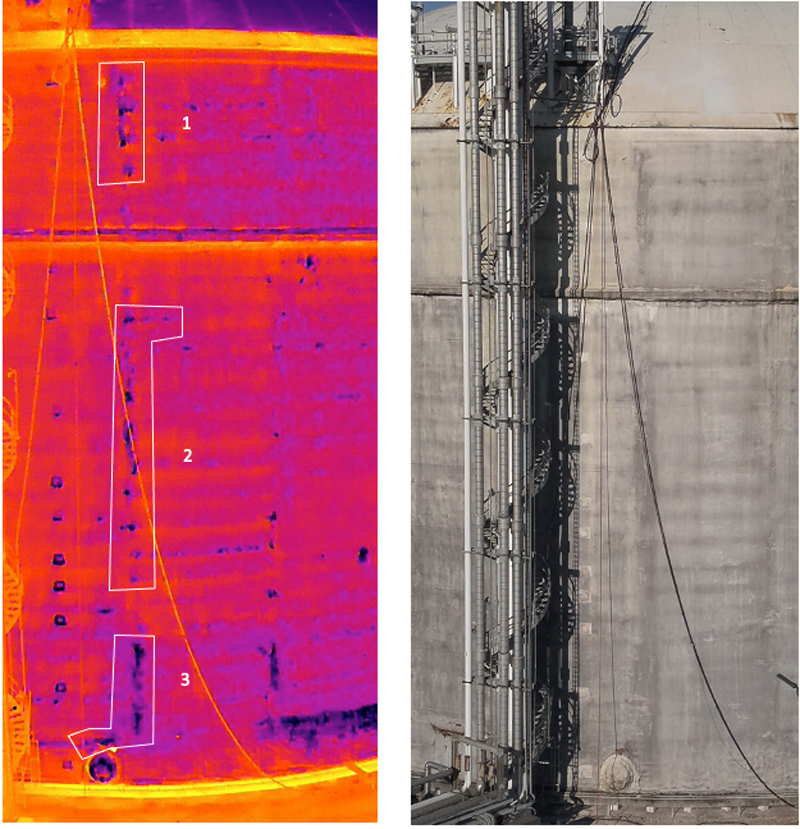
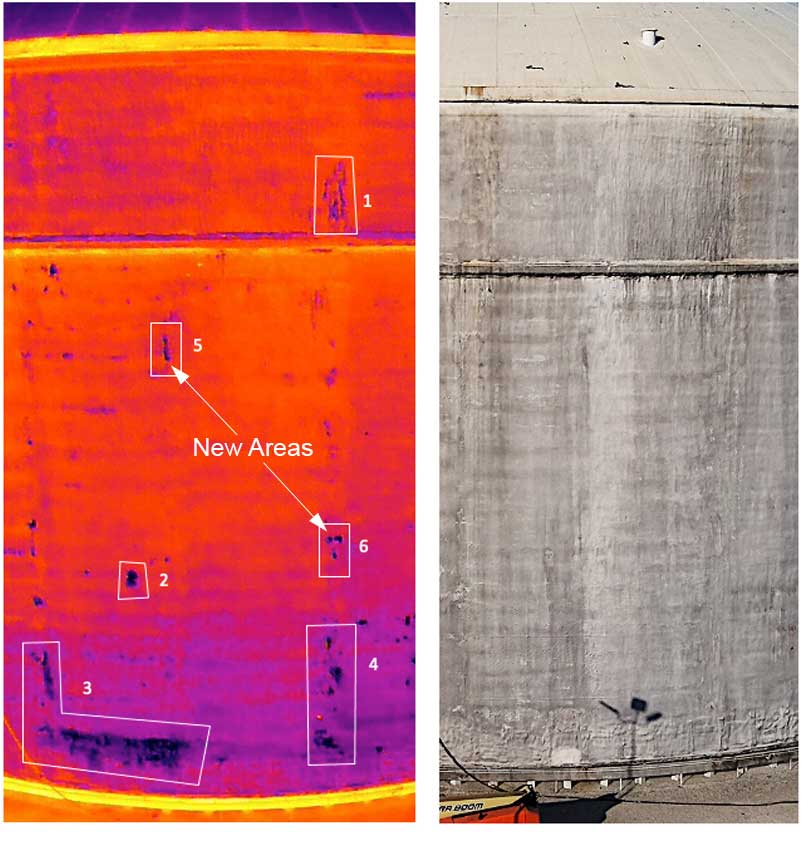
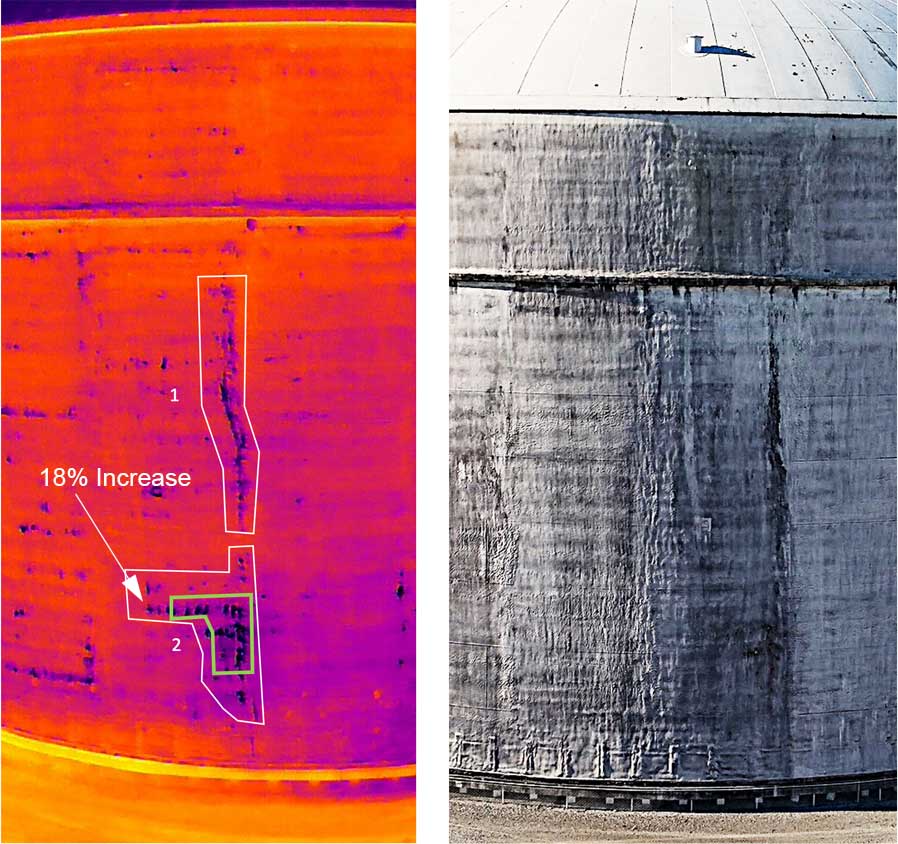
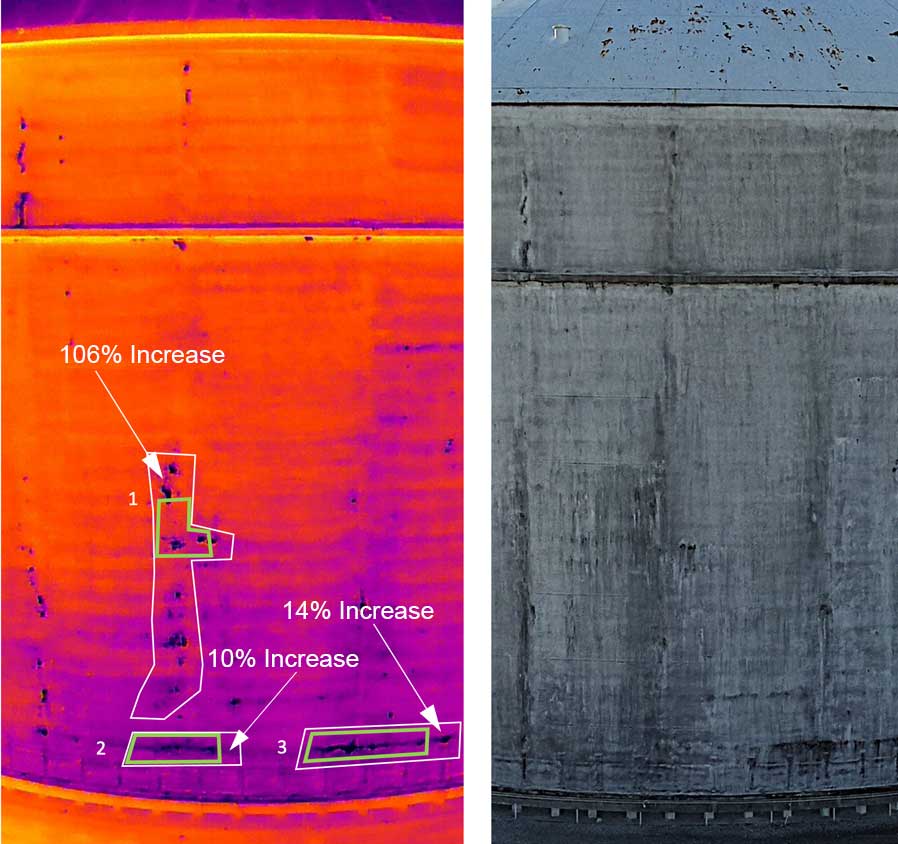
Below are thermal and visual images of several example sections. Current 2024 thermal anomalies are outlined in white. Additionally, areas where anomalies have grown since 2022 are highlighted in green and are located within the white outline.
Tank Section 1
Here are the thermal and visual images for section 1 of the tank facade. This section has three areas identified as thermal anomalies, and the size of these areas has remained unchanged since the previous inspection two years ago. On the left side of the outlined thermal anomalies, there are several dark spots, which are part of the external ladder and pipes and not part of the tank shell. On the right side of the outlines for section 1, there are additional dark areas overlapping from section 2 and are not outlined in this image set.
Image Type: Infrared/Visible
Equipment: Zenmuse H20T 640R-13mm 640×512
Estimated Anomaly Square Footage and comments:
Anomaly 1 – 60 sq’
Anomaly 2 – 210 sq’
Anomaly 3 – 100 sq’
Tank Section 2
Here are the thermal and visual images for section 2 of the tank facade. This section has six areas identified as thermal anomalies, representing an increase of two small anomalies since 2022. The new anomalies are numbered 5 and 6, and their details are shown below.
Image Type: Infrared/Visible
Equipment: Zenmuse H20T 640R-13mm 640×512
Estimated Anomaly Square Footage and comments:
Anomaly 1 – 50 sq’
Anomaly 2 – 80 sq’ – (seen in Section 1 but only outlined here)
Anomaly 3 – 200 sq’ – (seen in Section 1 but only outlined here)
Anomaly 4 – 50 sq’
Anomaly 5 – 8 sq’ – New area observed in 2024
Anomaly 6 – 8 sq’ – New area observed in 2024
Tank Section 3
Here are the thermal and visual images for section 3 of the tank facade. In this section, six areas have been identified as thermal anomalies. Anomalies 3, 4, and 5 have increased since the 2022 survey. In the thermal image below, the green outline indicates the 2022 area, while the white outline shows the expanded area.
Image Set/Location: 3
Image Type: Infrared/Visible
Equipment: Zenmuse H20T 640R-13mm 640×512
Estimated Anomaly Square Footage and comments:
Anomaly 1 – 150 sq’
Anomaly 2 – 112 sq’
Anomaly 3 – 250 sq’ – 13% increase since 2022
Anomaly 4 – 475 sq’ – 14% increase since 2022
Anomaly 5 – 150 sq’ – 212% increase since 2022

Tank Section 5
Here are the thermal and visual images for section 5 of the tank facade. In this section, there are two areas identified as thermal anomalies and only thermal anomaly 2 has has changed since the 2022 survey. In the thermal image below, the green outline indicates the 2022 area, while the white outline shows the expanded area.
Image Type: Infrared/Visible
Equipment: Zenmuse H20T 640R-13mm 640×512
Estimated Anomaly Square Footage and comments:
Anomaly 1 – 296 sq’;
Anomaly 2 – 295 sq’ – 18% increase since 2022
Tank Section 8
Here are the thermal and visual images for section 8 of the tank facade. In this section, all three areas identified in 2022 have increased since the 2022 survey. The growth of all three defects are seen in the thermal image below.The green outline indicates the 2022 area, while the white outline shows the expanded area.
Image Type: Infrared/Visible
Equipment: Zenmuse H20T 640R-13mm 640×512
Estimated Anomaly Square Footage and comments:
Anomaly 1 – 165 sq’ – 106% increase since 2022
Anomaly 2 – 66 sq’ 10% increase since 2022
Anomaly 3 – 123 sq’ 14% increase since 2022
In light of the findings from the annual inspection of this 24-year-old PNG tank, it’s clear that proactive measures are essential to address the identified thermal and visual anomalies. The Board of Directors will carefully review the data to assess the severity of these anomalies and prioritize necessary actions. With the updated short- and long-term budgets in place, the facility can effectively allocate resources for timely maintenance interventions, ensuring the continued reliability and efficiency of their refrigerated tank system.
This proactive approach underscores the commitment to safeguarding operational integrity and minimizing potential risks associated with insulation degradation.
