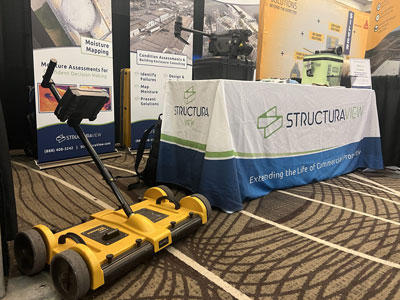
This week, we sent off our latest roof Moisture Survey for a 20-building school complex 🏫 which provides precise data, saving time and eliminating guesswork. 🚀 The contractor will present the data to the city for planning—and with clear insights, the contractor will get on the roof quicker knowing exactly what needs fixing. 🔍
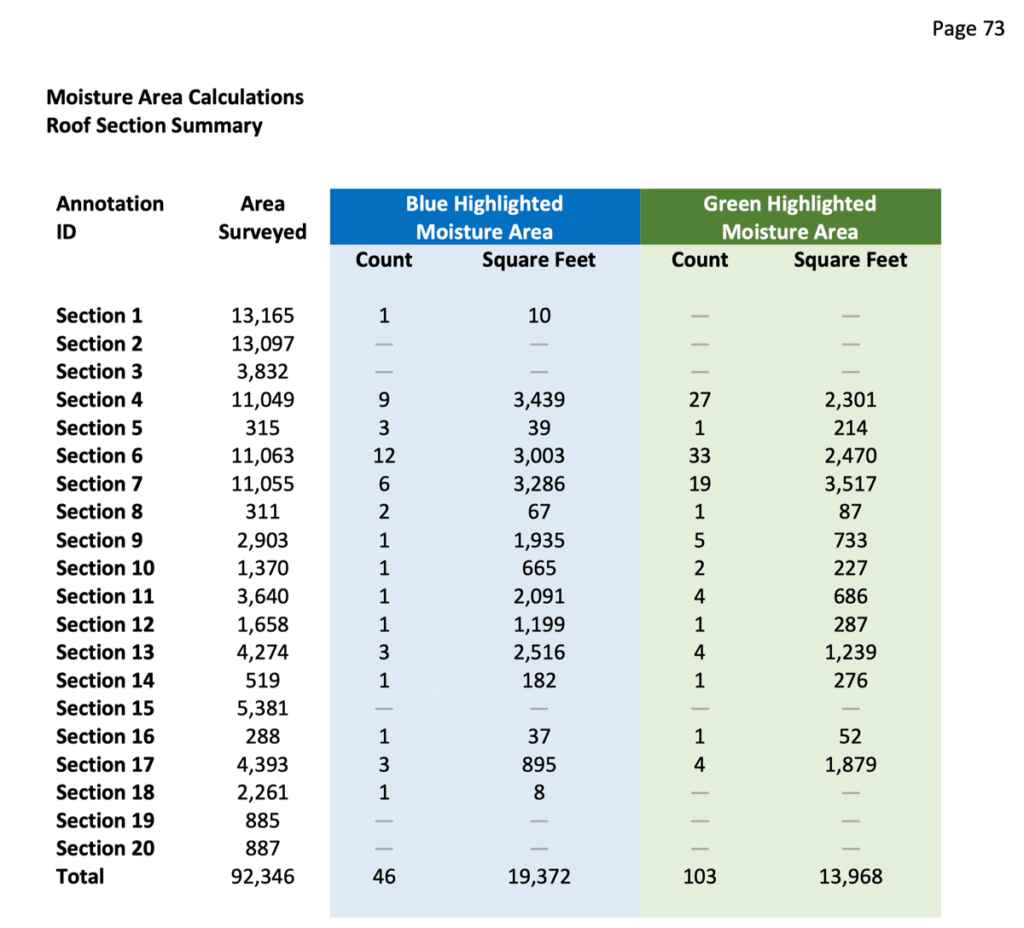
Moisture Area Calculations: Roof Section Summary
The table below displays data for 20 roofs surveyed in the school complex. Each roof is identified by a “Section” number, indicating the roof area in square feet, along with the corresponding moisture intrusions in square feet.
The complex has a combination of heavy and light moisture areas, differentiated by two colors. Blue highlights represent high moisture areas, while green areas indicate lower moisture levels radiating out from the center of the high moisture area.
With this information, both the roofing contractor and building owner can efficiently model moisture percentages in Excel and develop their repair and maintenance strategies.
The outlines of these blue and green moisture areas are highlighted just below this table.
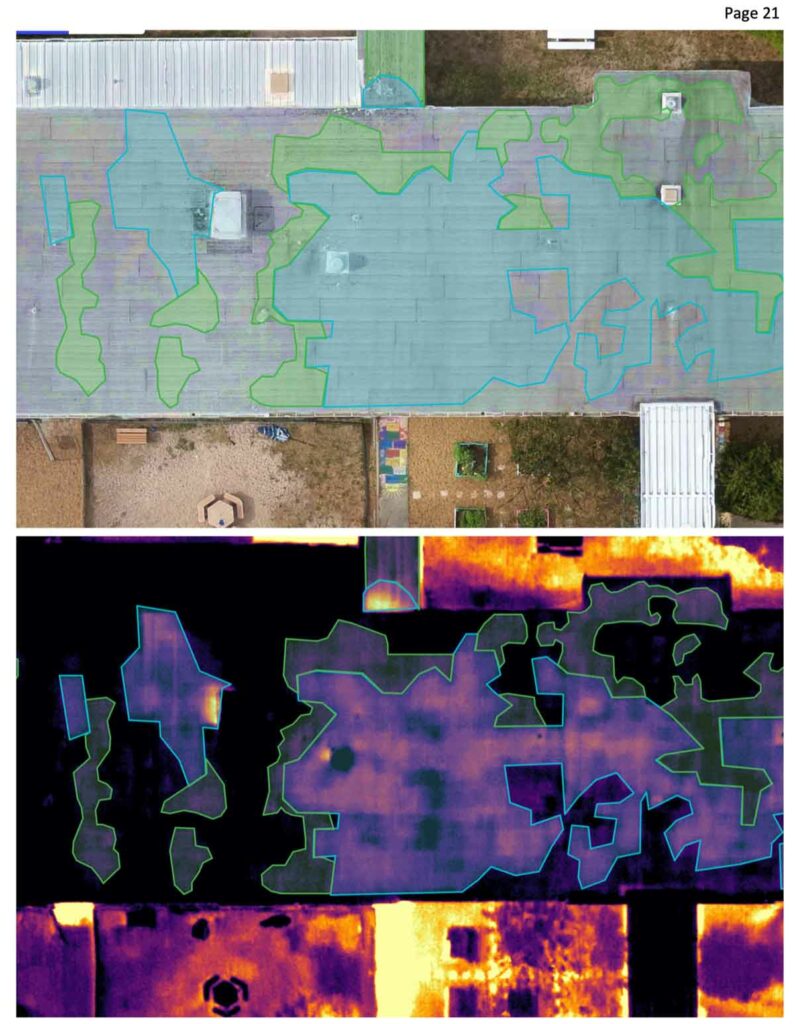
Close-up of the central portion of Roof Section 6 is depicted in both regular RGB (visual) and thermal images. As explained earlier, the moisture map is made up of blue highlighted areas indicating high levels of moisture, while the green areas represent lower levels of moisture intrusion surrounding the high moisture areas. This data is used by stakeholders when making their repair strategies.
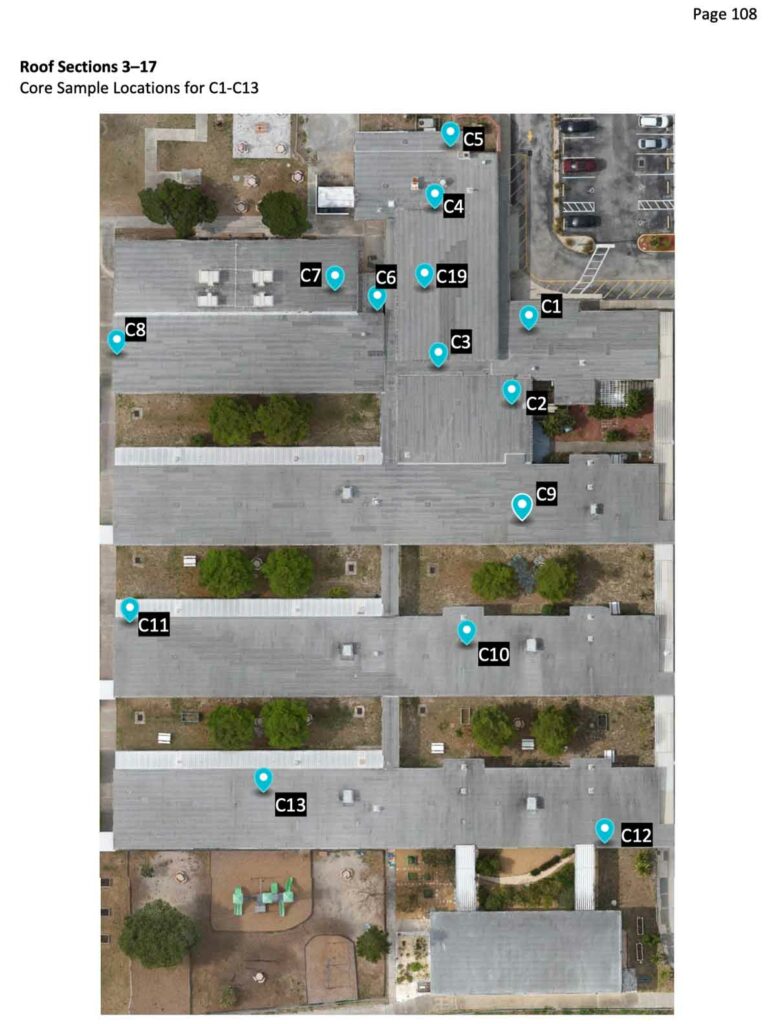
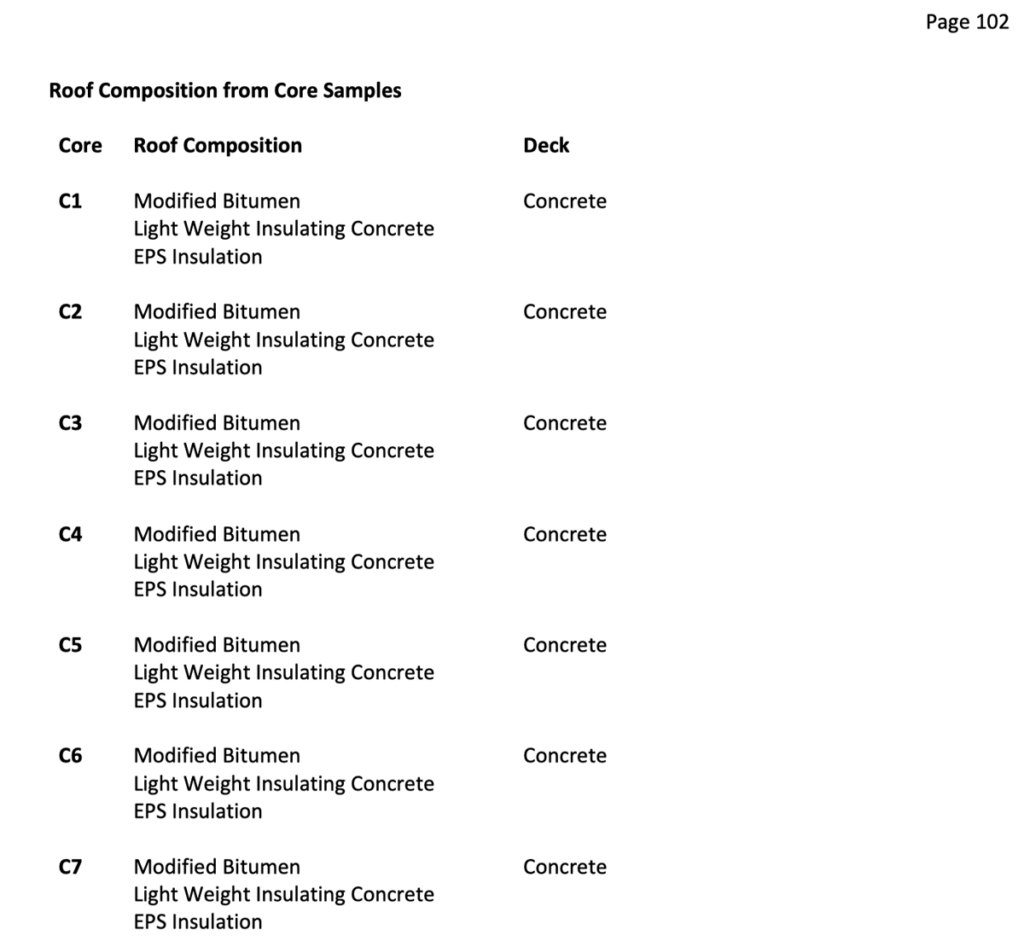
Core samples play a crucial role in validating assumptions about moisture locations and moisture levels when creating moisture maps. Below is a sample page from the report displaying the locations where core samples were taken. Following this image, you’ll find another page sample illustrating the roof material composition. Beneath that, we have a page sample showing the moisture levels detected in each layer of the roof.
When combined with the other information in the report, a narrative emerges that enables stakeholders to make informed decisions. It also allows contractors to start their projects faster and finish remediation efforts with fewer surprises.
Sample Page Showing Roof Material Composition
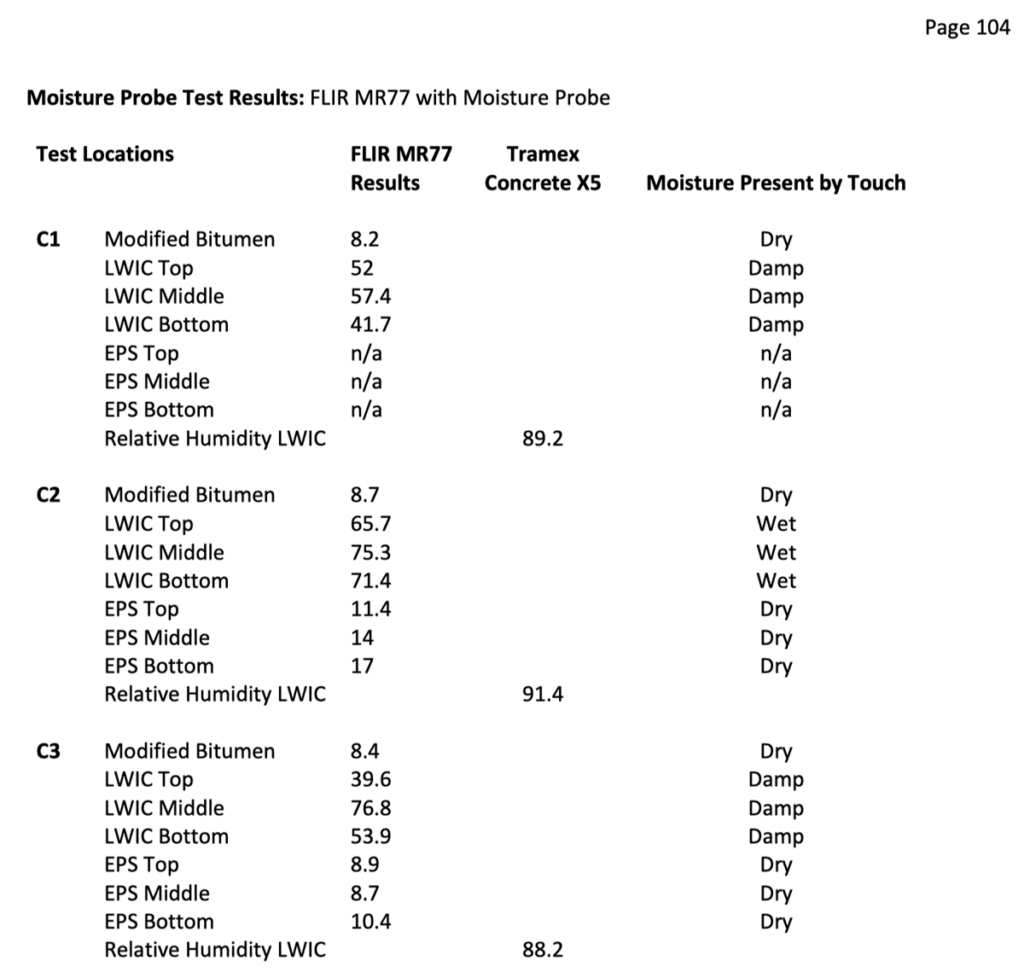
Sample Page Showing Moisture Levels Detected in Each Layer of the Roof
Ready to add data analysis & moisture mapping to your approach for roofing projects? Get in touch with us today and unlock the power of moisture intrusion data when making decisions for your next project!