Client Challenge
The city was dealing with an aging gravel-ballasted roof prone to leaks during rainy weather. Despite a previous attempt at repair with approximately 1,708 square feet of silicone coating, the data suggests the coating has either failed or was ineffective. Tasked with identifying the source of these leaks and performing necessary repairs, the roofing contractor faced a significant challenge—the contractor believes that simply repairing the roof may not be the most effective solution, considering its age and condition. There’s a suspicion that a more comprehensive approach may be needed and needs evidence to prove it.
In need of detailed data to fully assess the roof’s condition, the roofing contractor reached out to Structura View for assistance. The investigation was divided into two phases. Phase I involved thermal analysis supported by visual images to identify areas of suspected moisture intrusion and other roof damage. This phase also aimed to pinpoint locations for core samples to confirm suspected moisture intrusion and identify dry areas.
Once Phase I data is reviewed by both the roofing contractor and the city, Phase II will start. Phase II will take core samples at strategic locations to validate the suspected moisture areas identified in Phase I.
Status:
Currently Phase I is complete.
Phase II has not yet begun.
Let’s dive into the specifics of this project.
Roof Data
Location: Haines City, FL
Roof Area: Estimated 15,266 Square Feet
Moisture Content: Estimated 5,266 Square Feet
Percent of Moisture Intrusion: Estimated 35%
Roof Sections: 1
Roof Composition: Gravel-ballasted built-up roof with ISO insulation and Tectum deck
Type & Purpose of Survey: Thermal Roof Scan for Internal Suspected Moisture Content
Solution Strategy
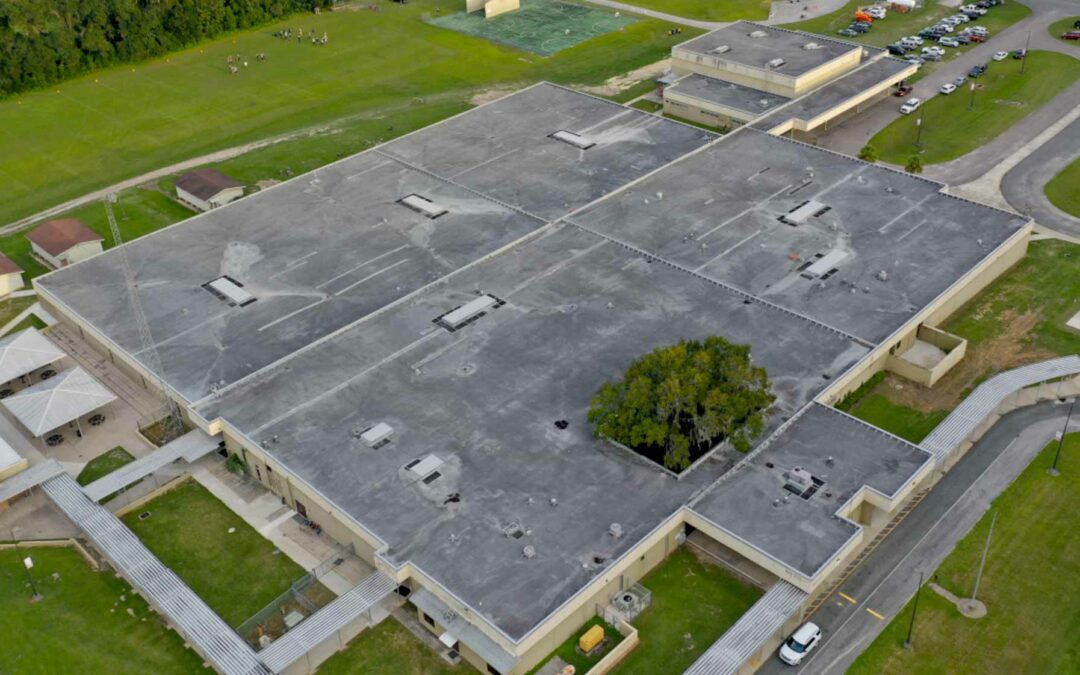
A drone-based visible and thermal scan of the roof for this city building was performed. The roof system is estimated to be 15,266 square feet in total size. The known composition is comprised of a gravel ballasted built-up roof with ISO insulation over a Tectum deck.
Two areas of the roof, totaling approximately 1,708 square feet, were coated with a silicone coating. Thermal anomalies were also present in the areas under the silicone coating.
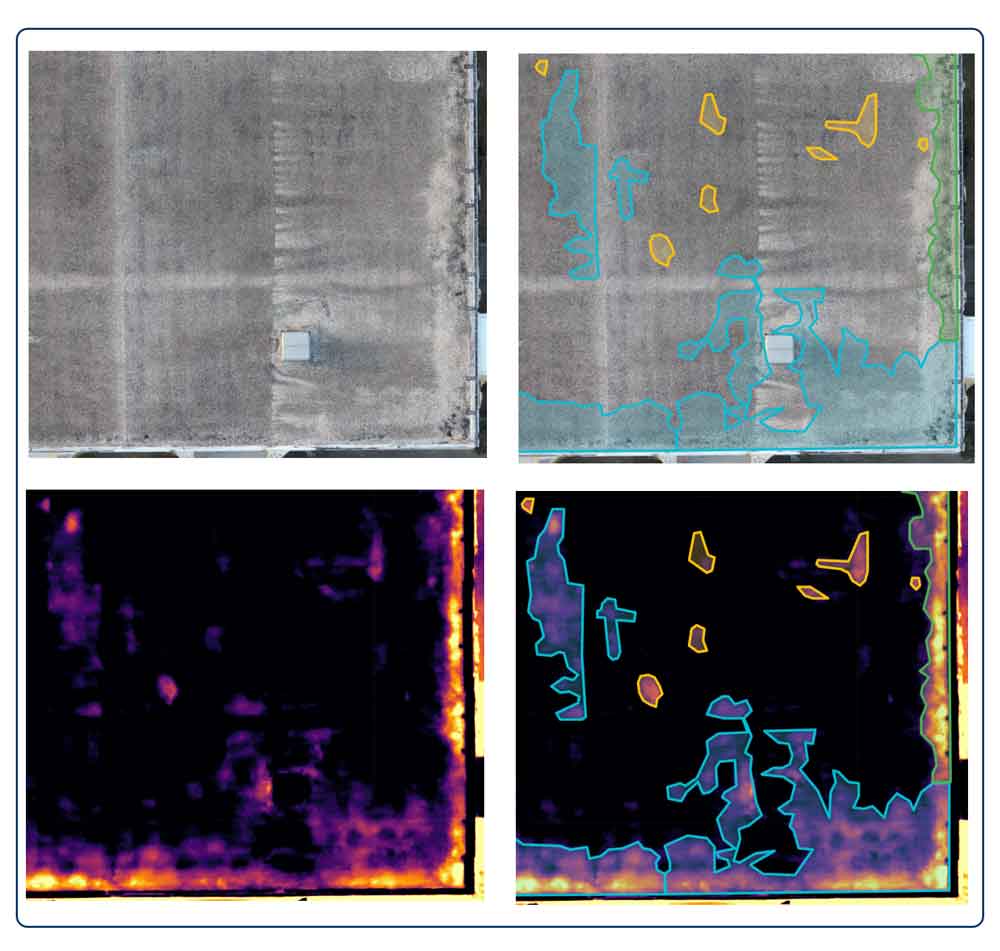
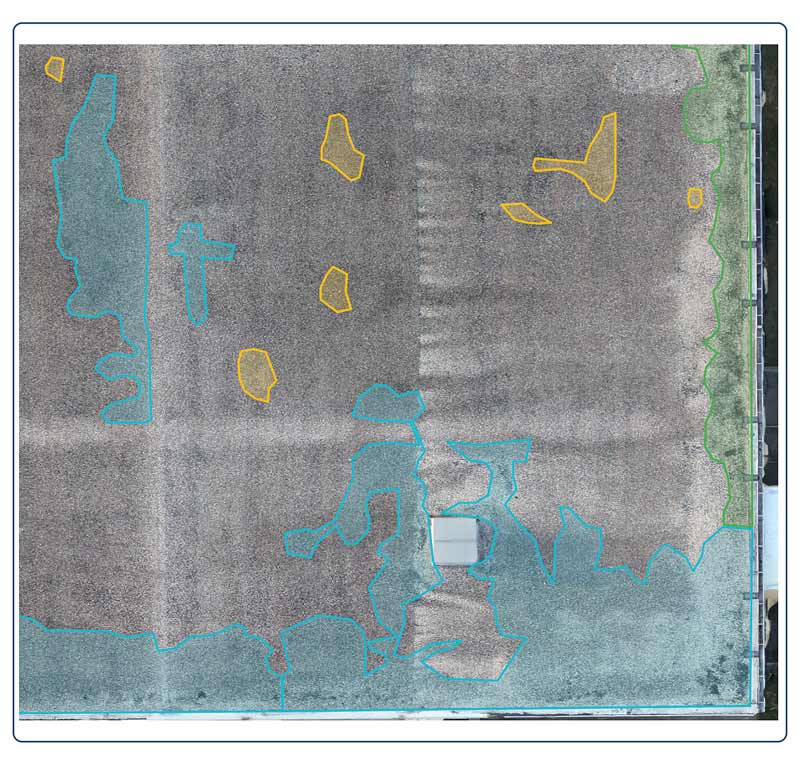
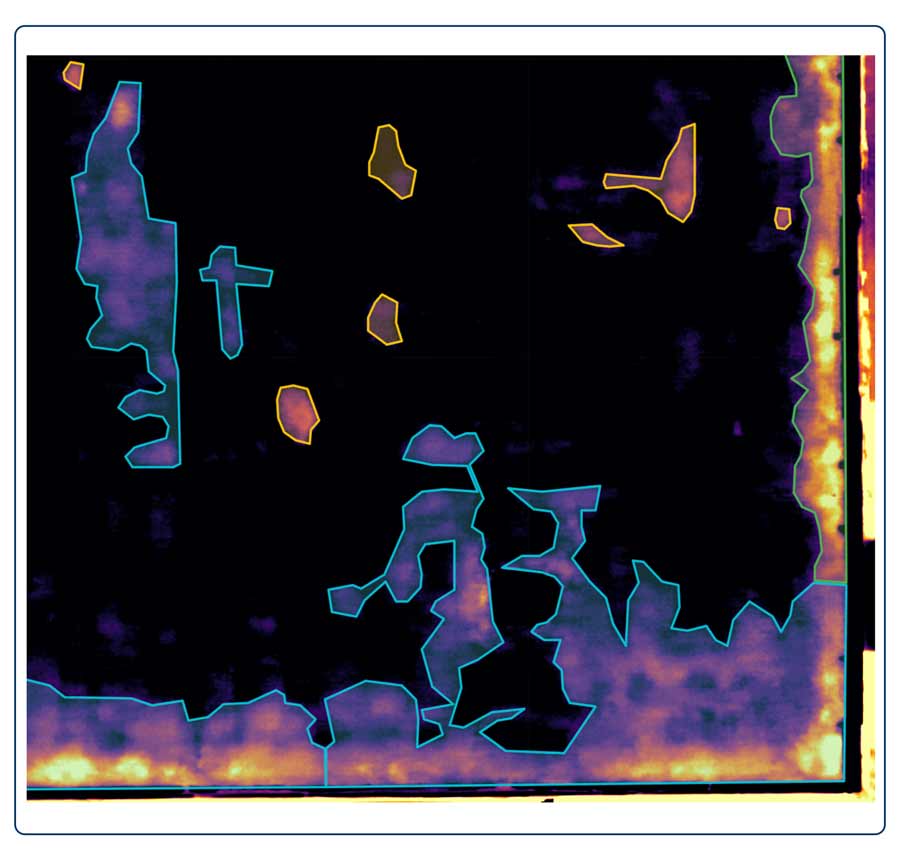
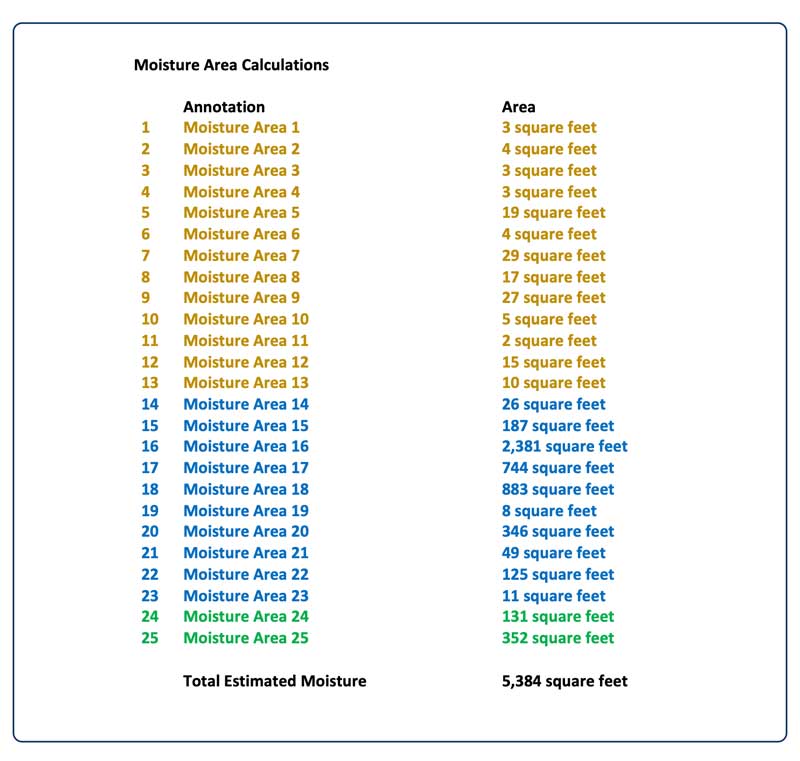
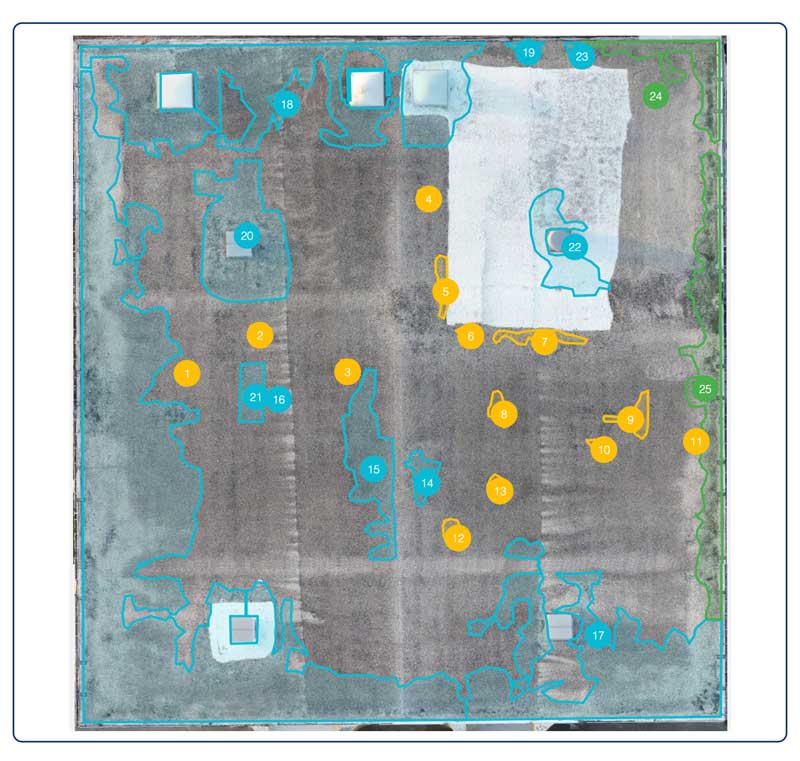
We identified a total of 25 suspected moisture locations from the collected data. Each location was highlighted in one of 3 different colors, blue, gold, and green, to help differentiate our interpretation of the thermal anomalies observed.
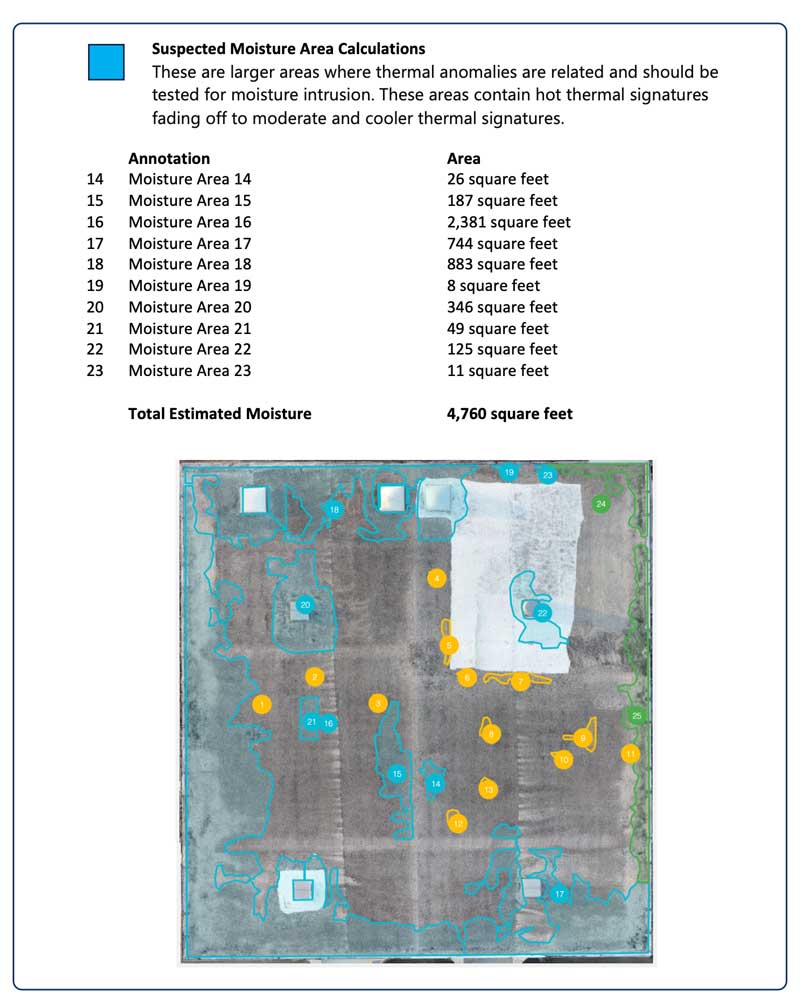
The anomalies highlighted in blue are suspected to be wet and the amount of moisture is expected to vary as it disperses from the point of entry based on the temperature data. These 10 blue-highlighted anomalies total an estimated 4,760 square feet in area.
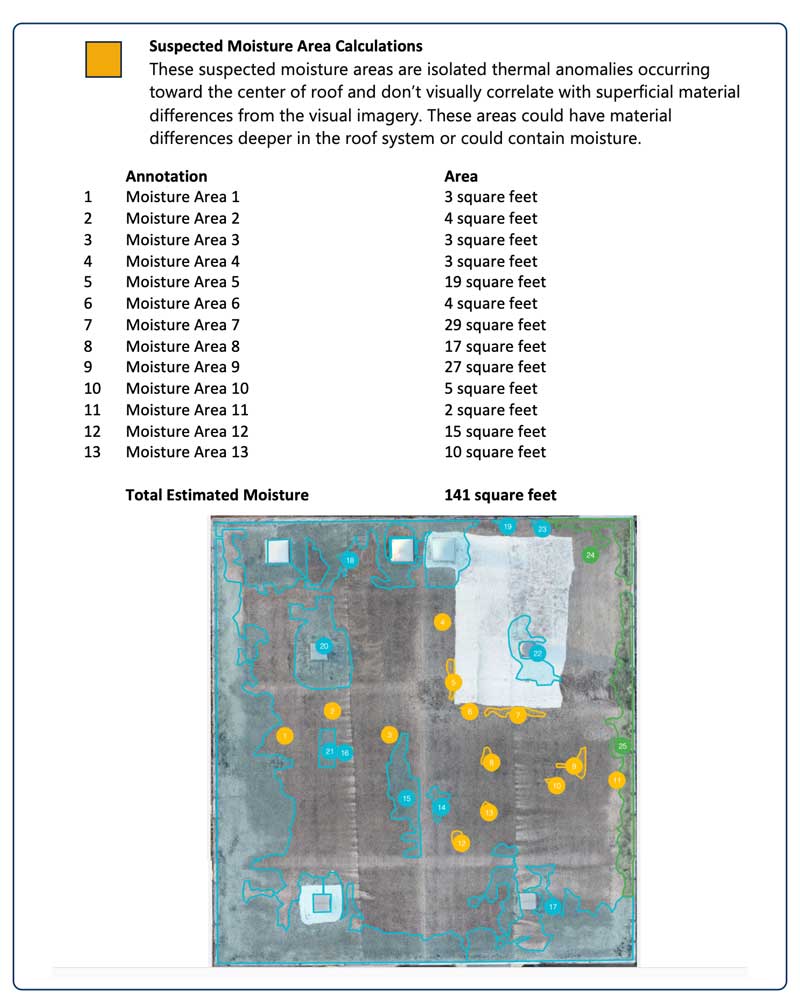
The gold-highlighted areas are suspected to correlate with moisture in the roof or could have material differences within the roof system. The anomalies are isolated and relatively small, with no significant anomalies around them to indicate moisture absorbing out from these locations. These 13 gold-highlighted anomalies total an estimated 141 square feet in area.
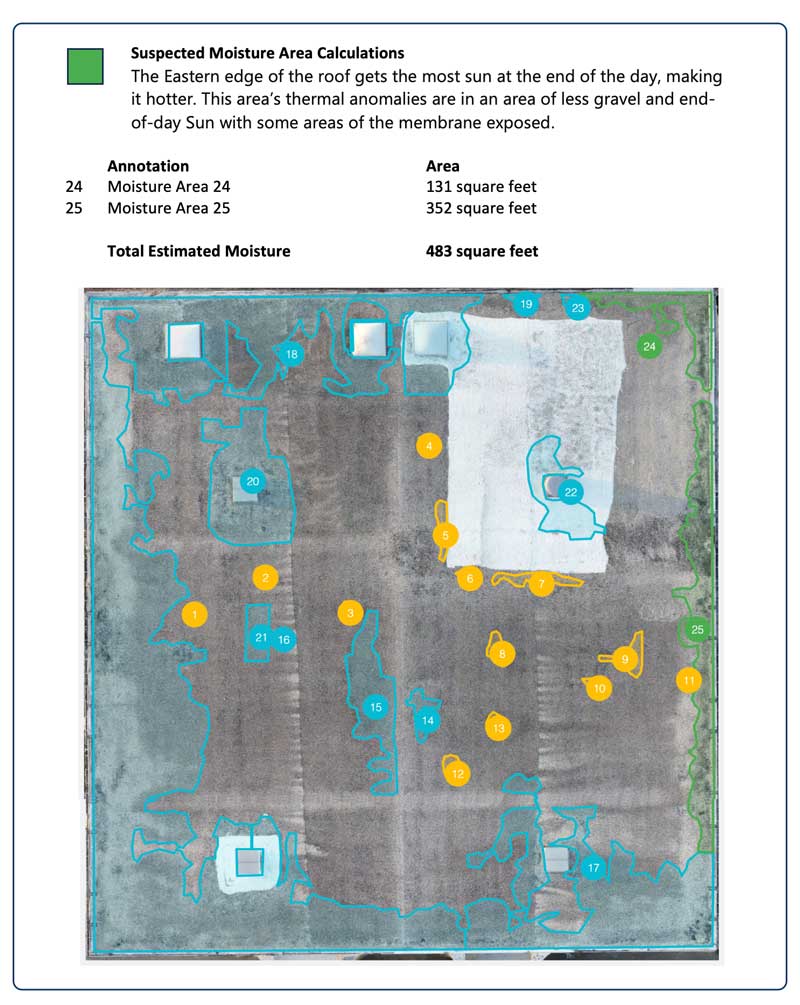
The green-highlighted areas are located on the eastern edge of the roof, showing a bright thermal signature. This could be due to a combination of this area receiving the most sun at the end of the day, along with the visual imagery showing less gravel and areas of exposed membrane. These 2 green-highlighted anomalies total an estimated 483 square feet in area and have been highlighted for further testing to verify if moisture is present in these locations.
In total, 25 thermal anomalies have been highlighted in blue, gold, and green on the roof that are suspected to correlate with moisture totaling an estimated 5,384 square feet in total area. Further testing is recommended to confirm the presence of moisture in the suspected moisture locations highlighted in this report.
Exploring the Data Insights from the Report: A Deep Dive
The ‘Roof Data Sheet’ below gives an overview on Roof Construction, Moisture Locations, and Suspected Moisture Content and other aspects of the roof system.
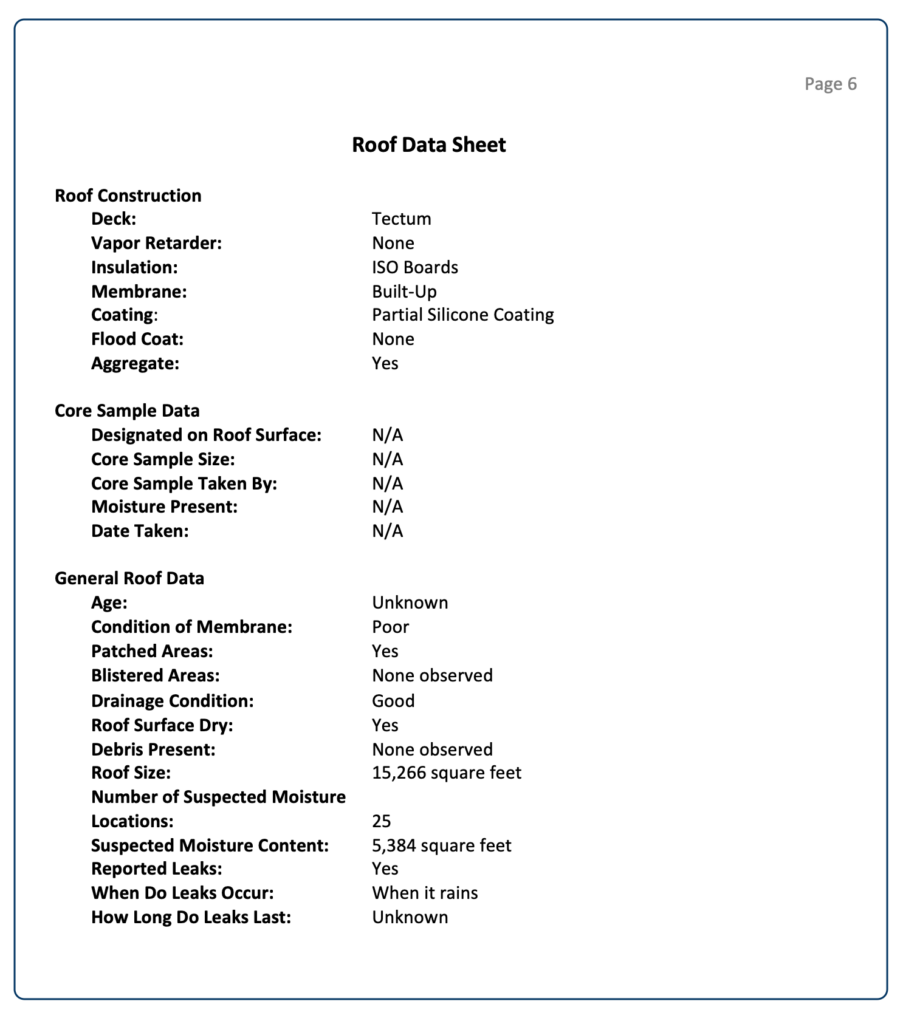
Image Analysis
Gravel-ballasted built-up roofs exhibit complex heat patterns due to their density and structure. To thoroughly assess these roofs, we conduct a series of comprehensive thermal scans over a period of several hours after sunset. These scans are processed and then allow us to analyze the evolving heat patterns over time, helping to distinguish between heat signatures associated with moisture, material differences, exposed built-up membranes, heat reflections, and other factors.
During our analysis of the heat patterns on this project, we identified three distinct types of patterns, each color-coded for clarity: blue, gold, and green. Blue-highlighted areas are suspected to be damp, with moisture levels expected to vary as it disperses from the point of entry. Gold-highlighted areas may indicate moisture in the roof or potential material differences within the roof system. Meanwhile, green-highlighted areas, located on the eastern edge of the roof, exhibit a bright thermal signature. This brightness may be attributed to a combination of factors, including maximum sun exposure at the day’s end and reduced gravel coverage with areas of exposed membrane.
By utilizing color-coded thermal highlighting of anomalies, we can distinguish between different groups of thermal patterns. These patterns guide us in identifying optimal core sample locations to validate our assumptions about moisture locations.
The analysis resulted in five sets of images. The first image set offers a visual and thermal overview of the entire roof, while sets 2–5 zoom in on each quadrant for closer examination. These high-resolution images assist in detailed planning and on-roof identification of specific thermal anomalies.
Below, you find Image Sets 1 and 3 as a representative sample, highlighting the suspected moisture areas identified for this project.
Image Set: 1
Subject Priority: 3
Height: 150’ AGL Stitched
Image Type: Infrared/Visible
Location: Overhead, Full Complex
Equipment: DJI Matrice 30T
Comments: Highlighted suspected moisture locations are represented on both thermal and visible images below.
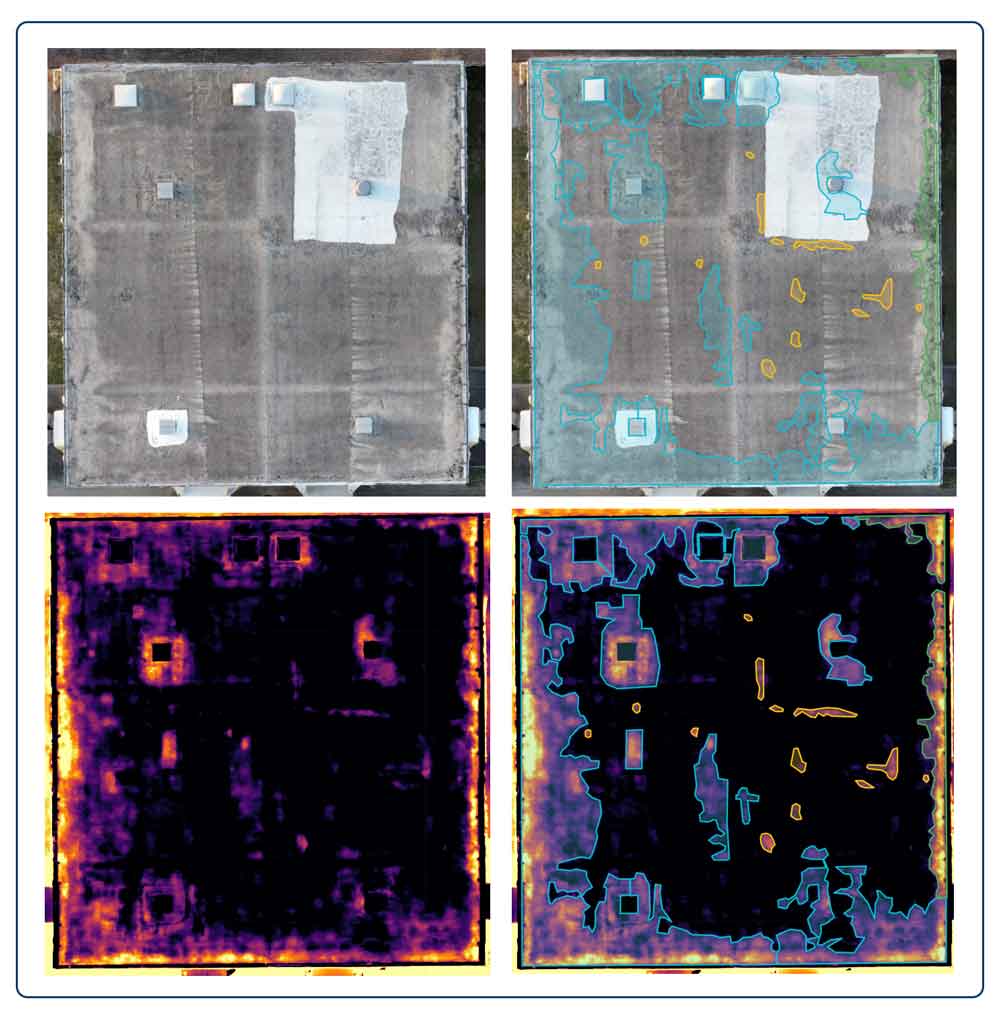
Image Set: 3
Subject Priority: 1
Height: 150’ AGL Stitched
Image Type: Infrared/Visible
Location: Southeast Close-Up
Equipment: DJI Matrice 30T
Comments: Highlighted suspected moisture locations are represented on both thermal and visible images below.
Roof Section Area Details
We have identified 25 moisture locations which make up approximately 35% of the total roof area. This breakdown categorizes the moisture areas into our three color groups and correlates each grouping with the total area, aiding in analysis and planning for the city and roofing consultant.
If you have any questions, feel free to reach out!
Moisture Validation: Phase II
Moisture Meter Testing Results &
Core Cut Details
The purpose of this Phase I thermal scan is to assess the roof for suspected internal moisture content to determine if more than a localized repair is required to address active roof leaks.
In many cases, building owners opt to conduct core samples immediately after the moisture scan, particularly when major repairs, a roof over, or a tear-off are anticipated. While the building owner, in this case, the city, has requested to locate and repair a leak, the roofing contractor sees the need for extensive work and requires data to support this assessment.
Therefore, the Phase I report will be reviewed by the city before starting Phase II, which will involve core cuts and moisture meter testing. By splitting the project into two phases, it helps manage the budget, prevents unnecessary expenses, and secures buy-in from all stakeholders.
Scheduled for Phase II
Date: To be determined
Key Insights and Upcoming Strategies
This suspected moisture report marks the first step in the process. The roof data shows approximately 35% of suspected moisture intrusion, reinforcing the roofing contractor’s concerns about the need for more significant repairs.
Pending approval from the city, the next step involves validating the suspected moisture intrusion areas. This validation process aims to confirm these suspected moisture areas and provide a comprehensive understanding of moisture intrusion in this roof, enabling informed decision-making and progression to the next steps.
Stay tuned for updates as we move through this process!