Client Challenge
The management team faced the challenge of an aging roof with active leaks and tackled the problem with thorough planning and organization. Collaborating with their roofing contractor, StructuraView conducted a comprehensive End-of-Life roof survey and analysis. Over the following 6 months, the management team, along with their roofing consultant, carefully evaluated the roof survey data to explore potential solutions, taking into account budget limitations and the long-term viability of different approaches.
Let’s take a look at the details of this project.
Roof Data
Location: Citra, FL
Roof Area: Estimated 146,694 Square Feet
Moisture Content: Estimated 10,828 Square Feet
Percent of Moisture Intrusion: Estimated 7.4%
Roof Sections: 11
Roof Composition: Modified bitumen membrane, backer board, Perlite, ISO boards, and metal deck
Type & Purpose of Survey: Survey Low-Sloped Roof for Internal Moisture Content
Solution Strategy
A thermal scan documenting the present condition of the roof system was done. Numerous thermal anomalies were observed with varying temperature readings that were highlighted for further testing and observation. Some of the hotter, larger temperature readings were suspected to be saturated. The numerous smaller anomalies that were lower temperature readings were suspected to either correlate with past repairs, less roof materials being present due to a tapered system, or would reflect lower amounts of moisture content present in the composition.
Aerial visible imagery was also taken and reflected numerous repairs and patches throughout the roof system.
We also performed a non-destructive impedance moisture survey with TRAMEX RWS scanner and selected core cut locations based on the suspected wet and dry locations observed in the thermal imagery. The locations that reflected higher temperature readings reflected high levels of moisture while the lighter anomalies produced mixed results of no moisture to low amounts of moisture in the roof.
From the walk-through, numerous blisters and repairs were observed throughout the roof. Some of the repaired areas have failed. Some locations reflected moisture in the roof system while others were allowing moisture into the membrane but not absorbing into the insulation yet.
Based on these results and observations, 18 core sample locations were selected to be cut and tested the following morning.
Let’s Dive into the Data Insights from the Report
The ‘Roof Data Sheet,’ below gives a comprehensive snapshot detailing basic roof attributes. This overview encompasses details including Roof Construction, Number of Moisture Locations, and Suspected Moisture Content.
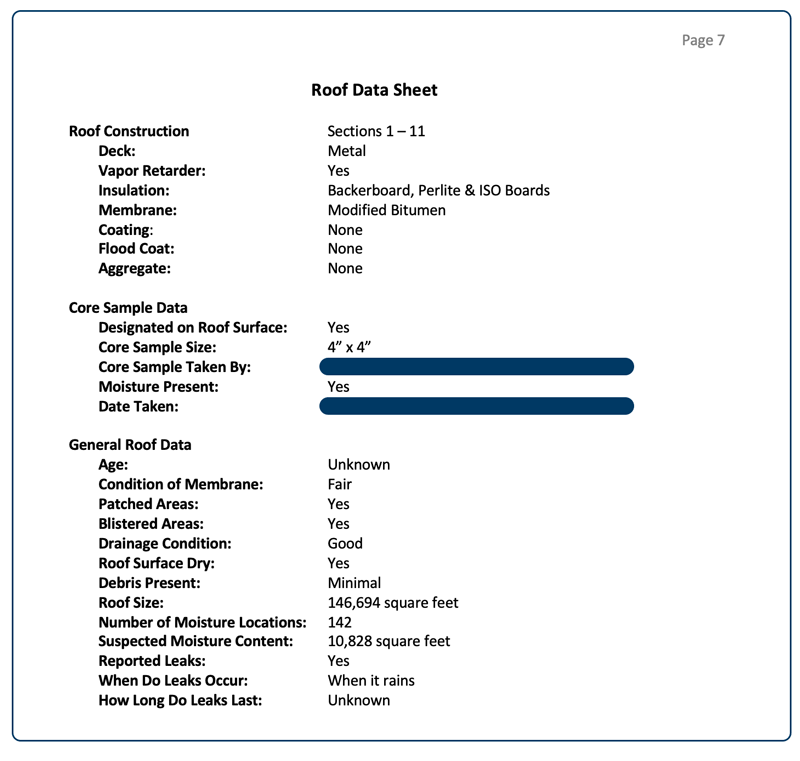
Image Analysis
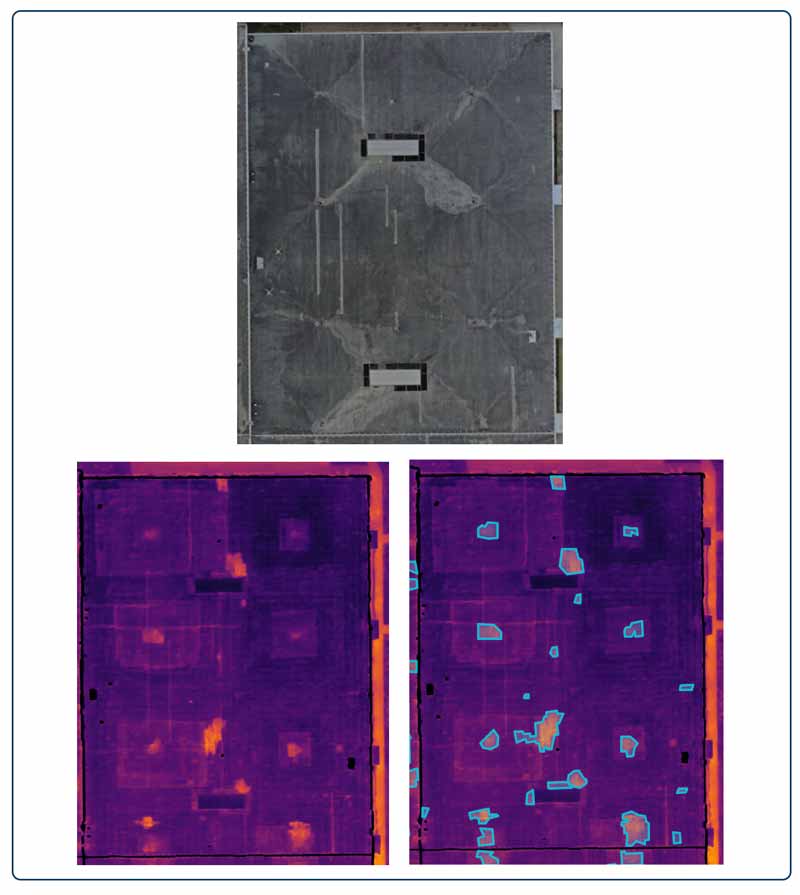
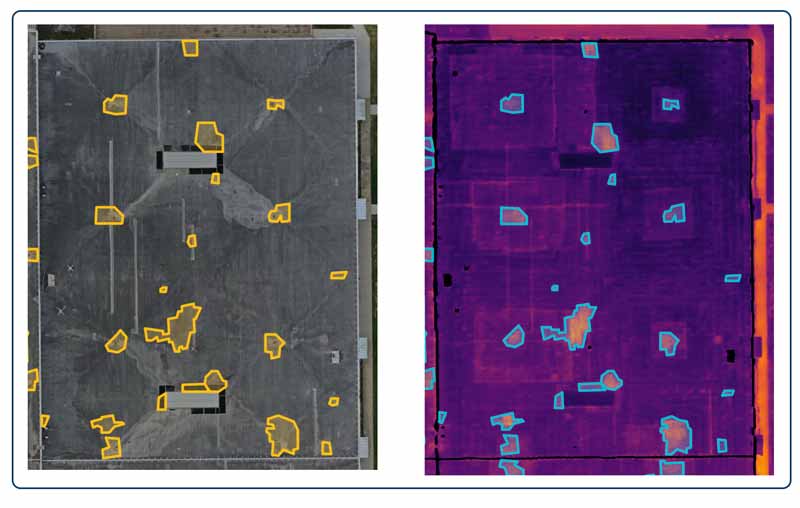
The next 19 pages of the report contain detailed visual imagery, with 10 image sets showing the visual and thermal conditions of the roof. In these images thermal anomalies are outlined in blue on the thermal imagery and their corresponding locations are highlighted in yellow-gold on the visual images. These colors are used for contrast and ease of viewing.
After collecting the data, we identified and highlighted 142 moisture locations, totaling an estimated 10,828 square feet of moisture observed in the roof system, a sample of which you can found in this case study.
Nearly all roof drains showed varying moisture levels, with some retrofits correlating with heavy moisture areas. Additionally, patches throughout the roof reflected varying amounts of moisture. Lighter thermal anomalies often corresponded to lighter moisture levels at the deck or membrane, though they were not fully saturated.
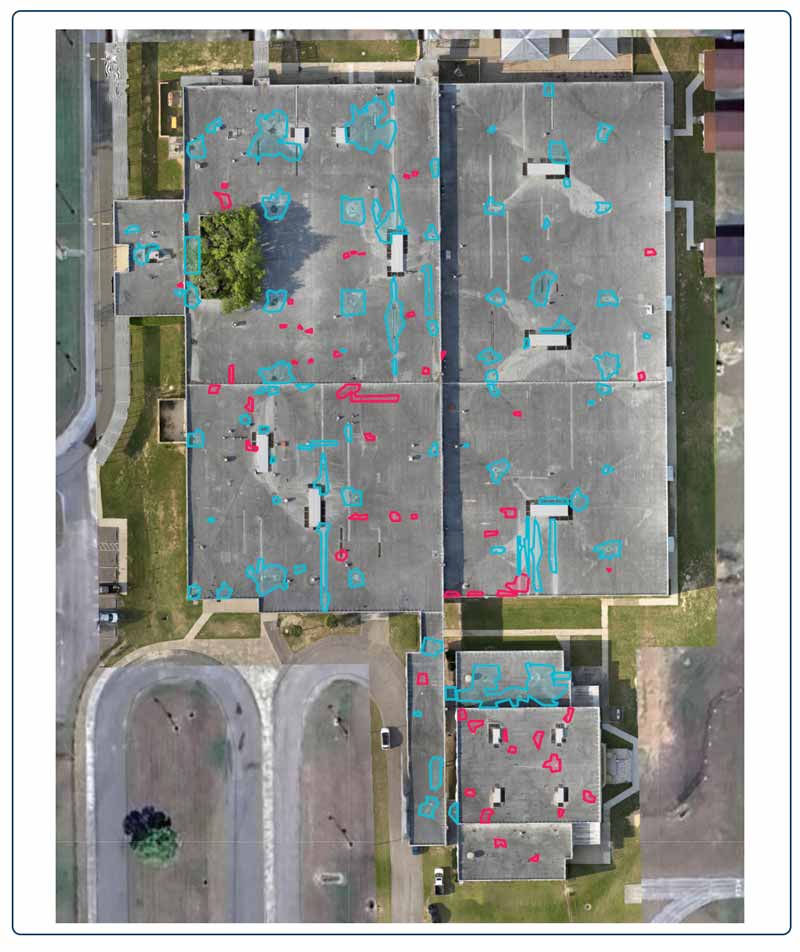
Image Set 1 shown below shows is an overview of the full complex and the subsequent Images Sets are close-up views showing details of isolated sections and areas.
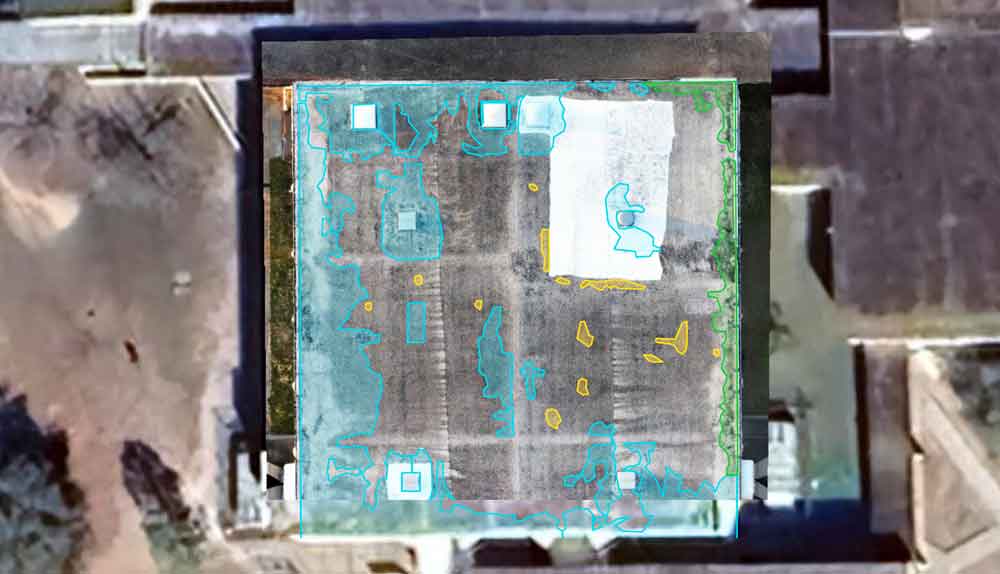
Below are sample image sets 1 and 10 which are taken from the final report.
Image Set: 1
Subject Priority: 2
Height: 200’ AGL Stitched
Image Type: Infrared/Visible
Location: Overhead, Full Complex
Equipment: DJI Zenmuse XT2 640R, TRAMEX RWS
Comments: Numbers on the visible image below represent the roof section number. Highlighted suspected moisture locations are represented on both thermal and visible images below.
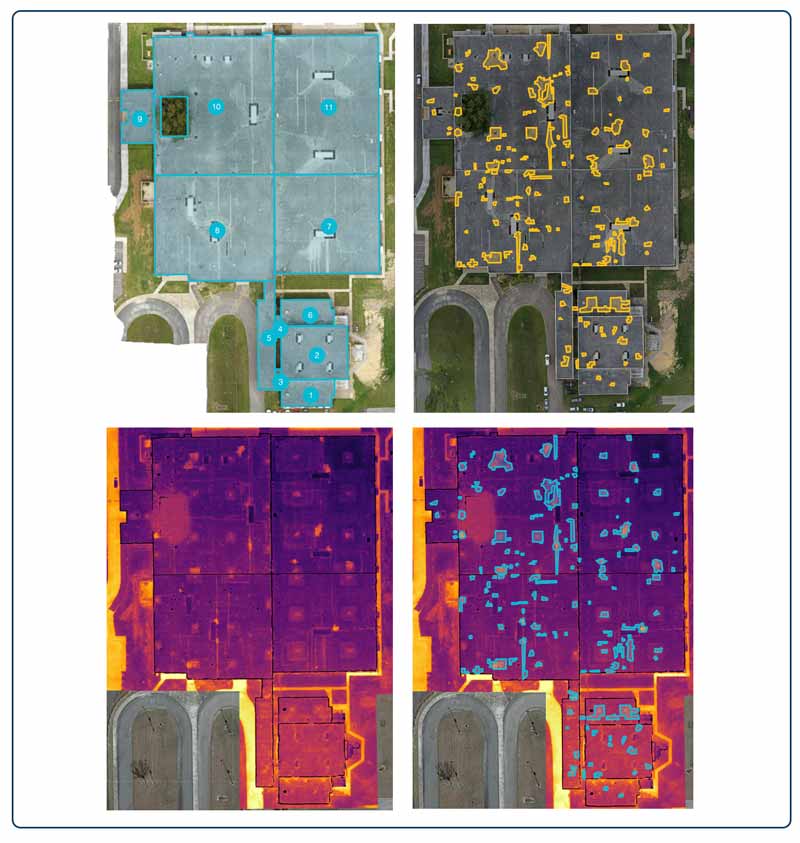
Image Set: 10
Subject Priority: 2
Height: 200’ AGL Stitched
Image Type: Infrared/Visible
Location: Section 11
Equipment: DJI Zenmuse XT2 640R, TRAMEX RWS
Comments: Highlighted moisture locations are represented on both thermal and visible images below.
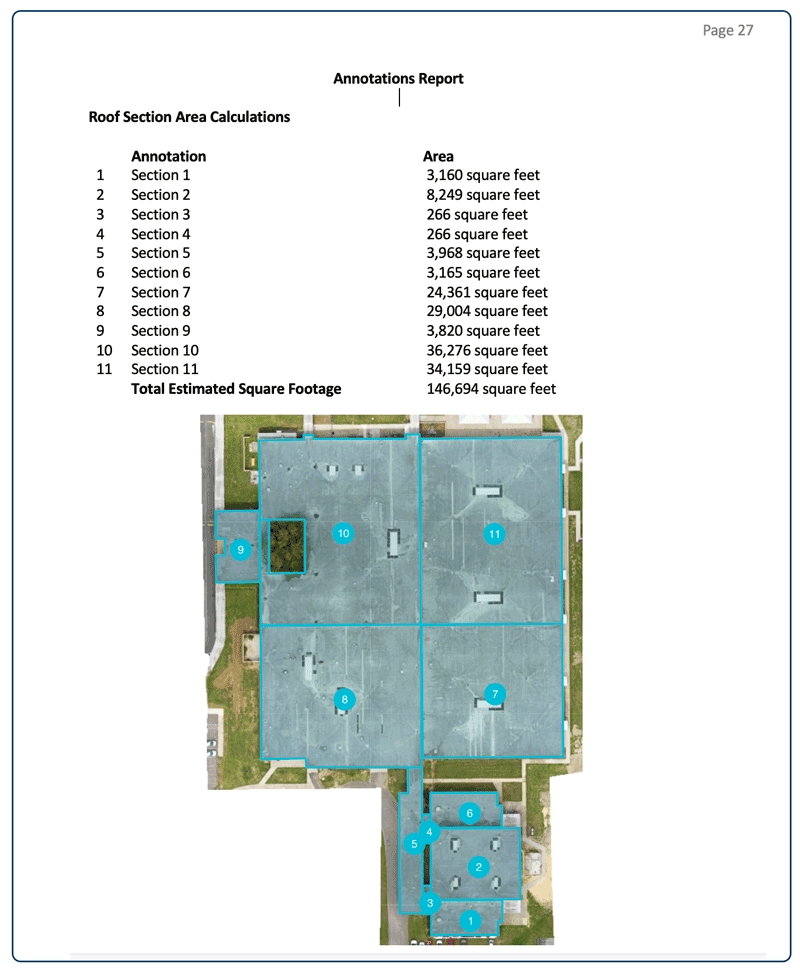
Roof Section Area Details
The total roof area is 146,694 square feet, with 10,828 square feet, or approximately 7.38%, experiencing moisture intrusion. Below, you’ll find the moisture area calculations for roof sections 1 through 11.
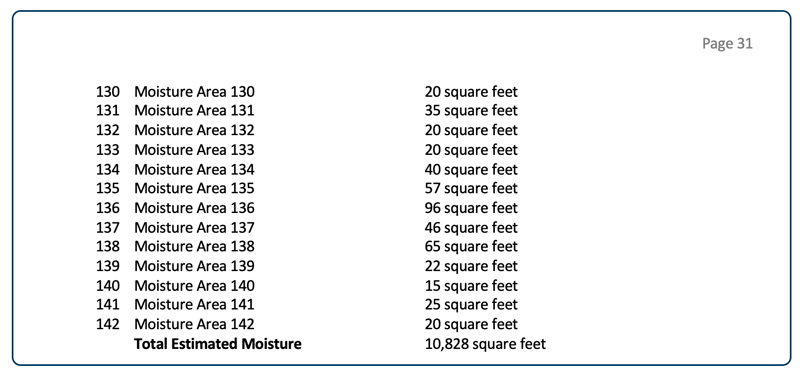
Moisture Area Details
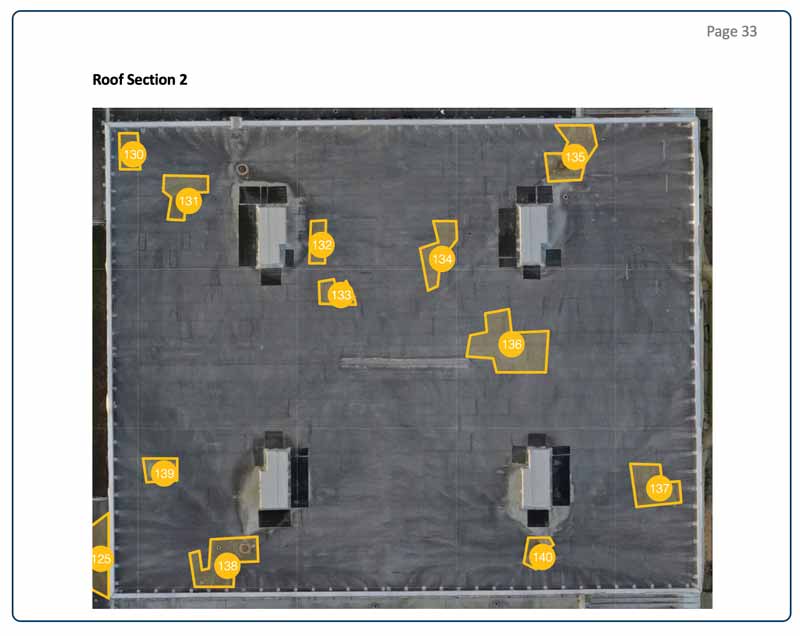
In the “Moisture Area Details” section, we outline the moisture area for each thermal anomaly, assigning an ID number to each intrusion. These IDs correspond to a map, serving as a key to locate each area. Below, you’ll find a sample of the Moisture Area Calculation for moisture areas 130–142, along with Roof Section 2, highlighting the ID numbers and the affected areas.
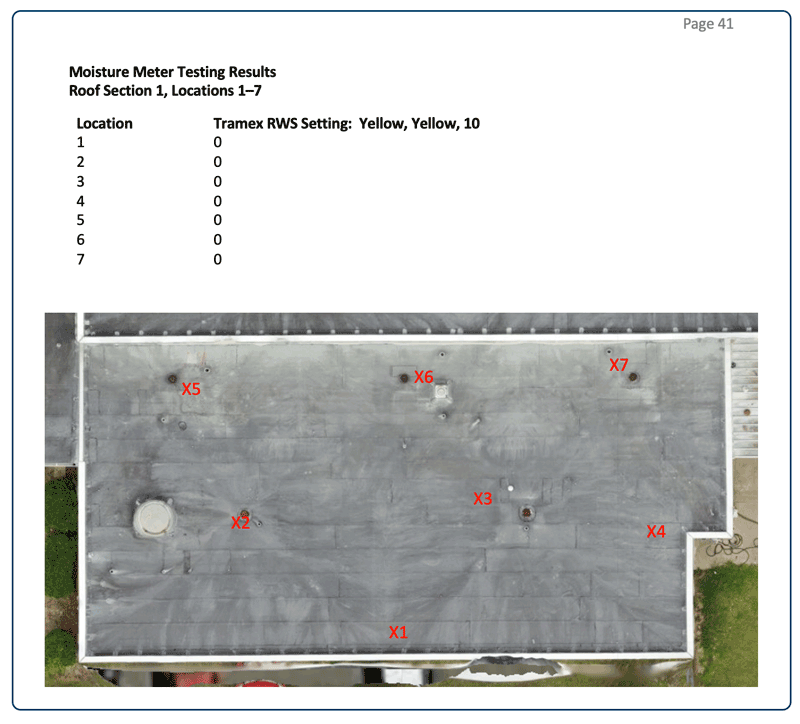
Moisture Meter Testing Results
We conducted a non-destructive impedance moisture survey at 295 points. The below graphic is a sample page from the report, displaying Roof Section 1 and its corresponding moisture locations 1–7 which have a moisture value of 0 and are all dry.
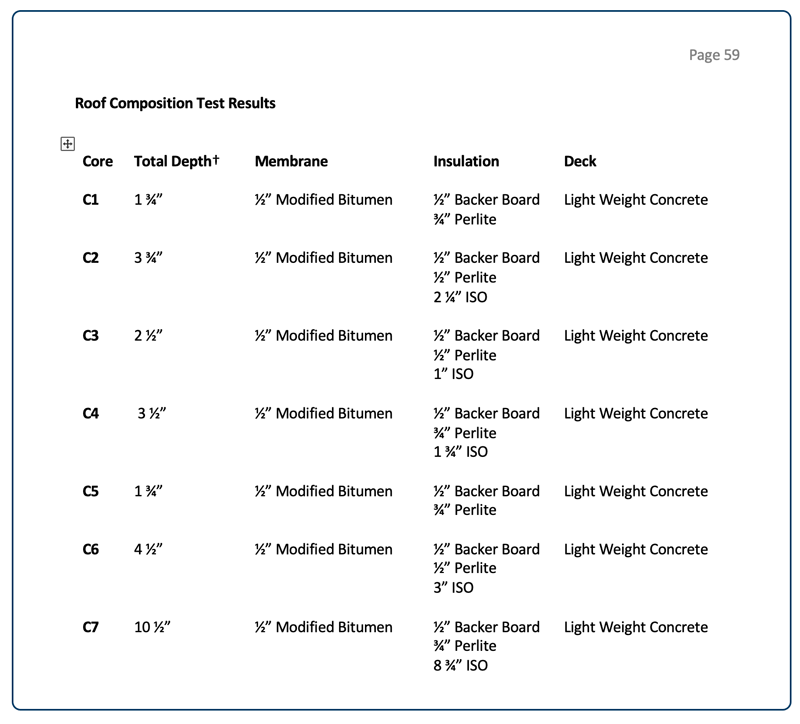
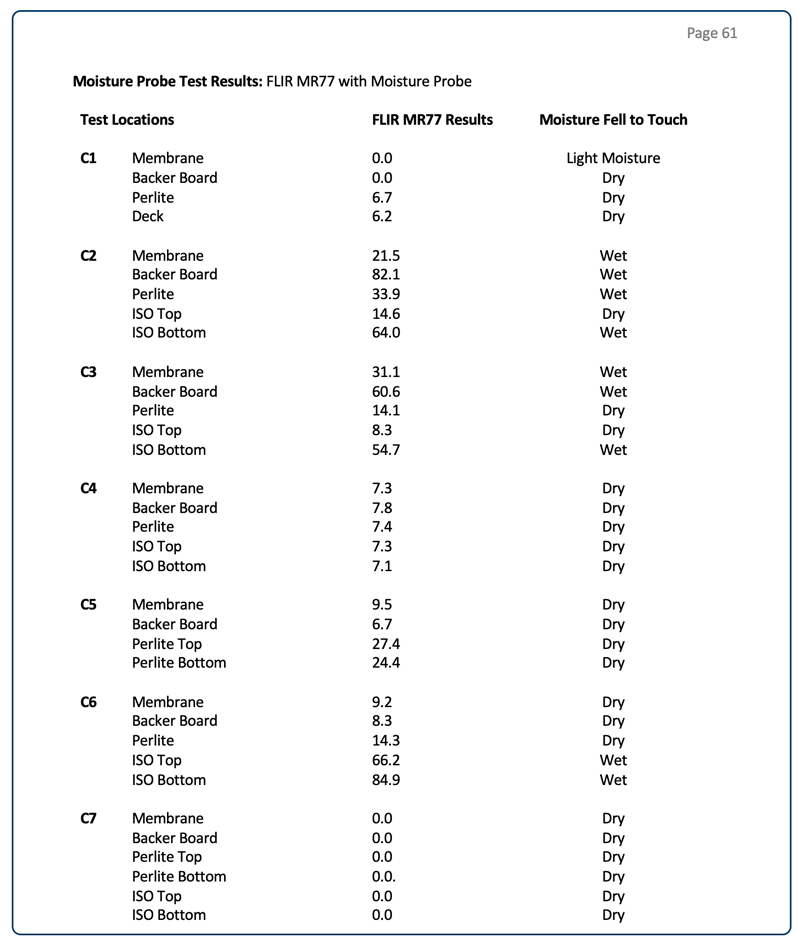
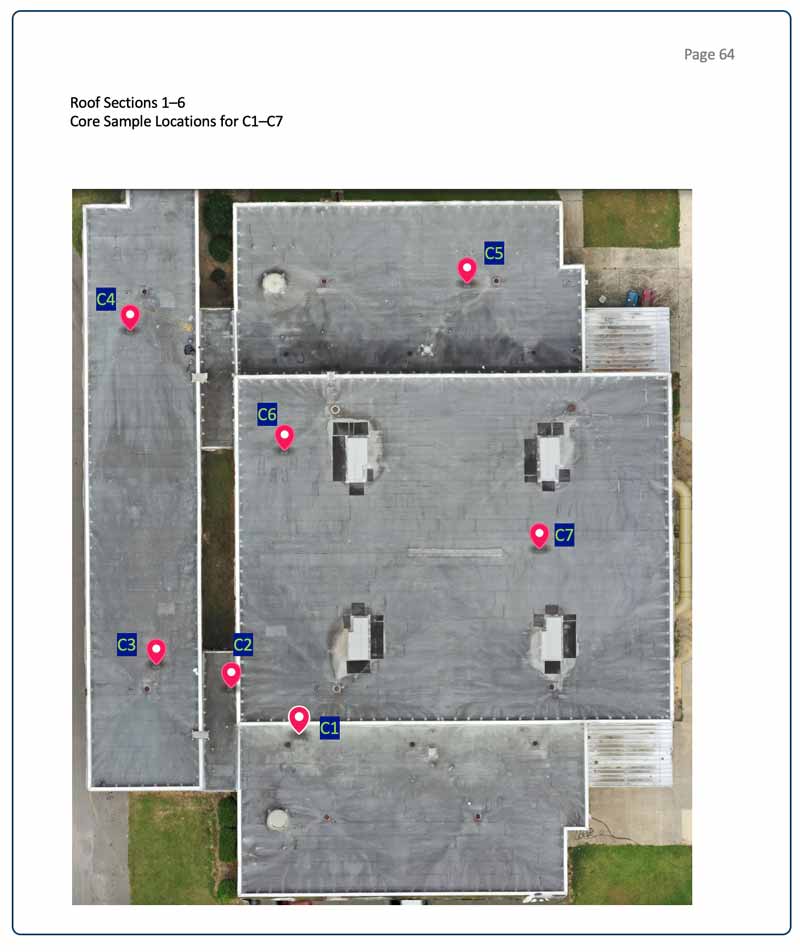
Core Cut Details
18 core cuts were taken to help validate suspected wet/dry locations and understand where moisture is retained within the roof’s composition. These locations were strategically selected to help us understand the moisture observed in the thermal imagery and impedance moisture testing. The images below show a sample of the Core Cut data pages documented in the report.
Key Findings and Future Plans
After analyzing the roof survey data, we confirmed that the moisture intrusion rate in the roof system was just under 8%.
The management team and roofing contractor took several months to review the results and agreed to address the areas of moisture intrusion by repairing them and installing a second roof system.
Structura View then returned to the project and marked the moisture intrusion areas directly on the roof using orange spray paint. Additionally, we provided a visual map, shown below, highlighting moisture areas in blue and red. Blue indicates regions with high moisture intrusion, while red signifies areas with low to moderate moisture intrusion.