Client Challenge
The management of this health facility faces the challenge of a failing roof system. Faced with the prospect of an expensive full roof replacement, they are looking for viable alternatives to extend the roof’s lifespan. Working with their roofing contractor, their objective is to assess the extent and locations of water intrusion, as well as identify any other underlying issues. With a focus on cost-effectiveness, they are exploring the feasibility of a roof coating as a potential solution to prolong the roof’s lifespan.
Roof Data
Location: Homerville, Georgia
Roof Area: Estimated 43,610 Square Feet
Moisture Content: Estimated 19,285 Square Feet
Percent of Moisture Intrusion: Estimated 44%
Roof Sections: 3
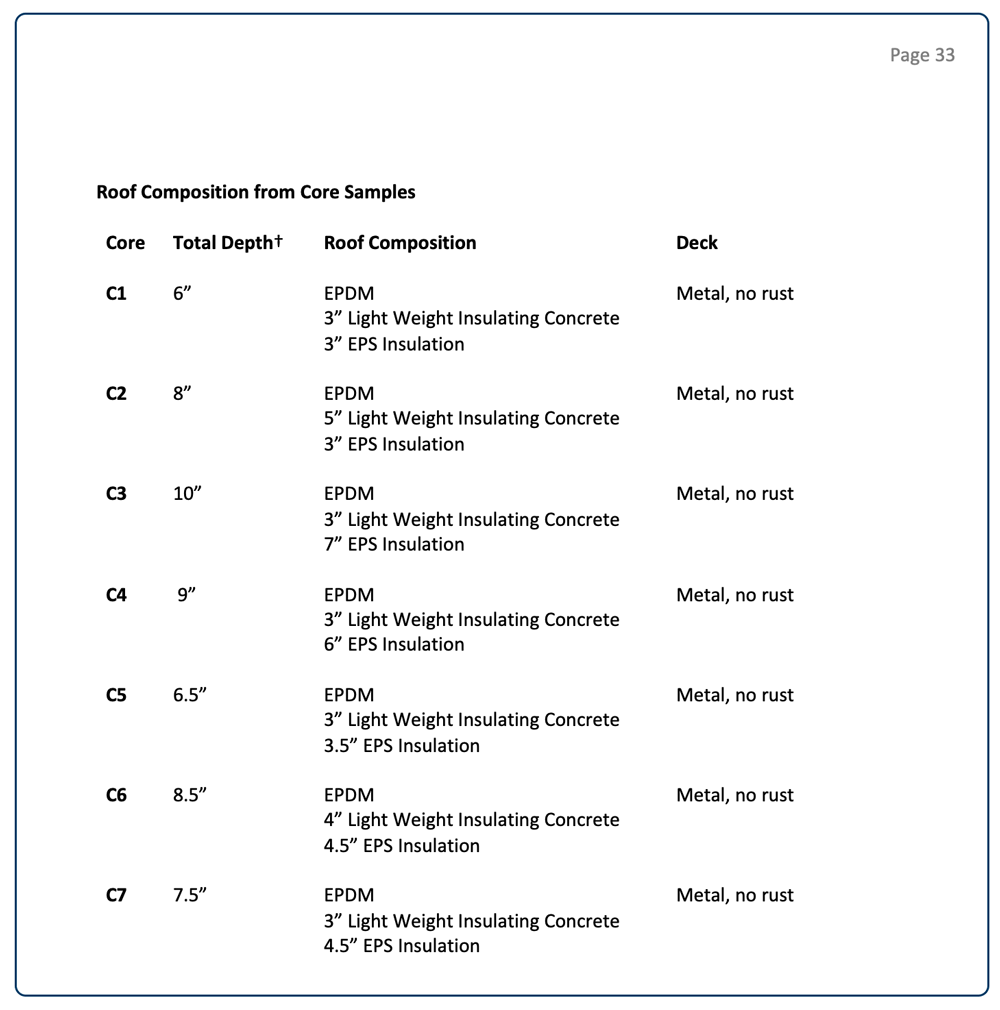
Roof Composition: EPDM membrane, lightweight insulating concrete, EPS insulation, and metal deck
Type & Purpose of Survey: Survey Low-Sloped Roof for Internal Moisture Content
Solution Strategy
The roof has 3 sections totaling an estimated 43,610 square feet in total area. The composition of each section is comprised of an EPDM membrane, lightweight insulating concrete, and EPS insulation over a metal deck.
Utilizing drone-based technology, we conducted a comprehensive visible and thermal scan to assess the current condition of the roof system. During the scan, we observed various thermal signatures across the roof system, each indicating different temperature ranges. These observations prompted further testing and observation. Details of this scan are provided later in this case study.
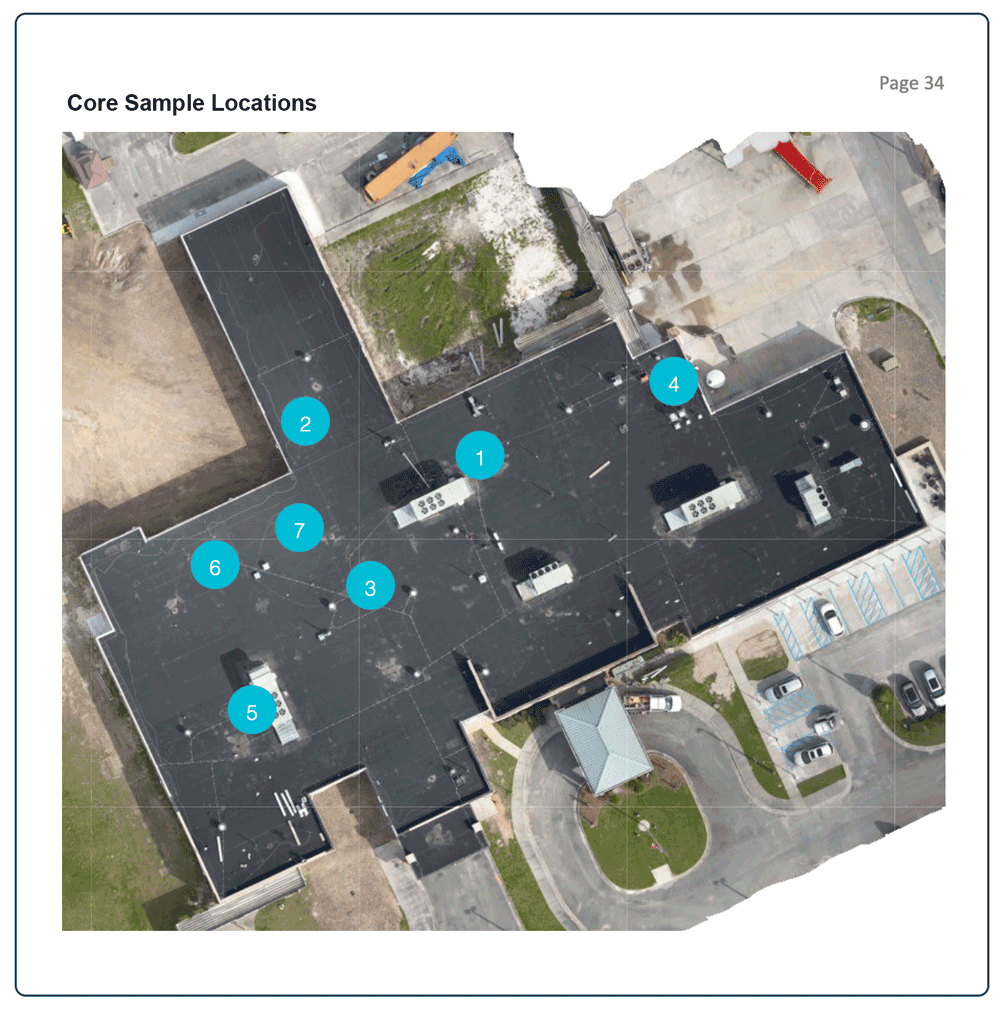
Using our thermal imagery as a reference, 7 core cuts were taken to validate suspected wet and dry areas, which help to understand where moisture is retained within the roof’s structure. Detailed core cut results are documented are provided later in this case study.
Let’s Take a Look at Key Data Points from the Report
The first notable page in the report is the “Roof Data Sheet”, providing a concise summary of key roof attributes. This sheet offers a high-level overview, with detailed information on aspects such as Roof Construction, Moisture Location, and Core Sample data which are elaborated in more detail further within the report.
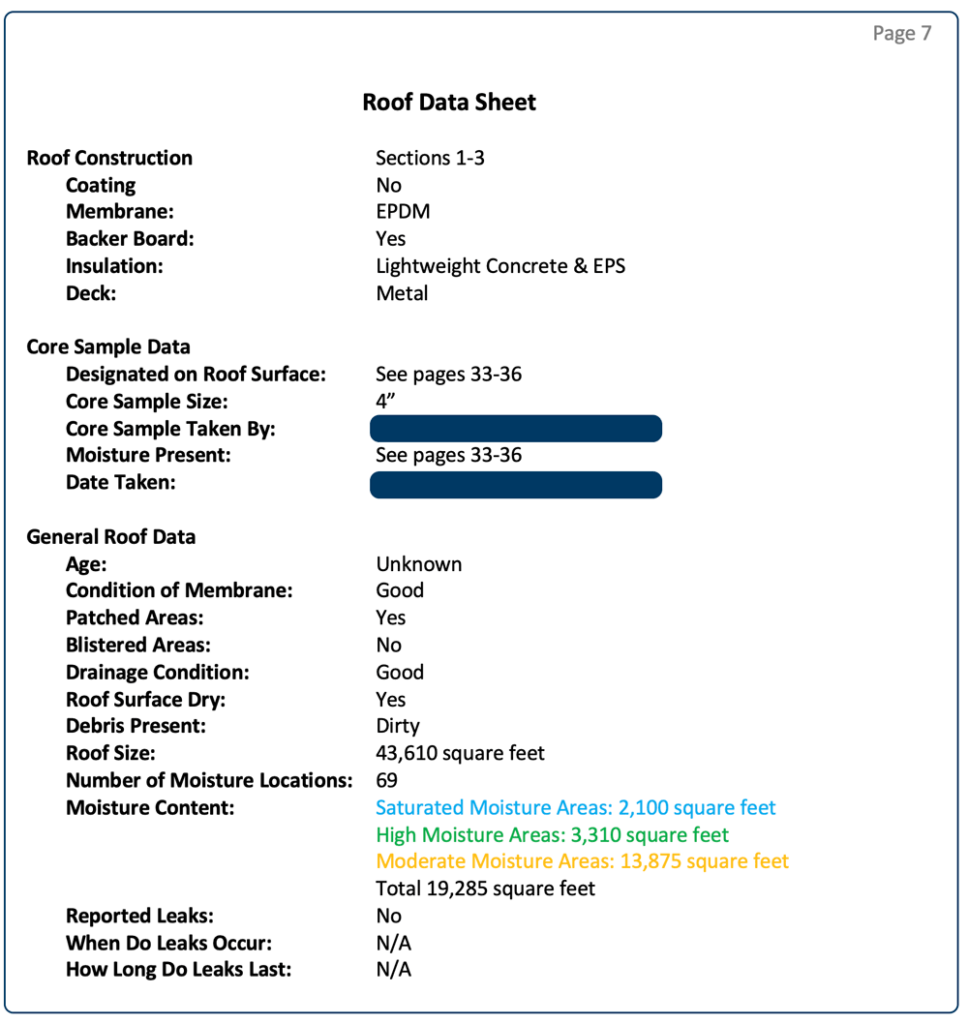
Image Analysis
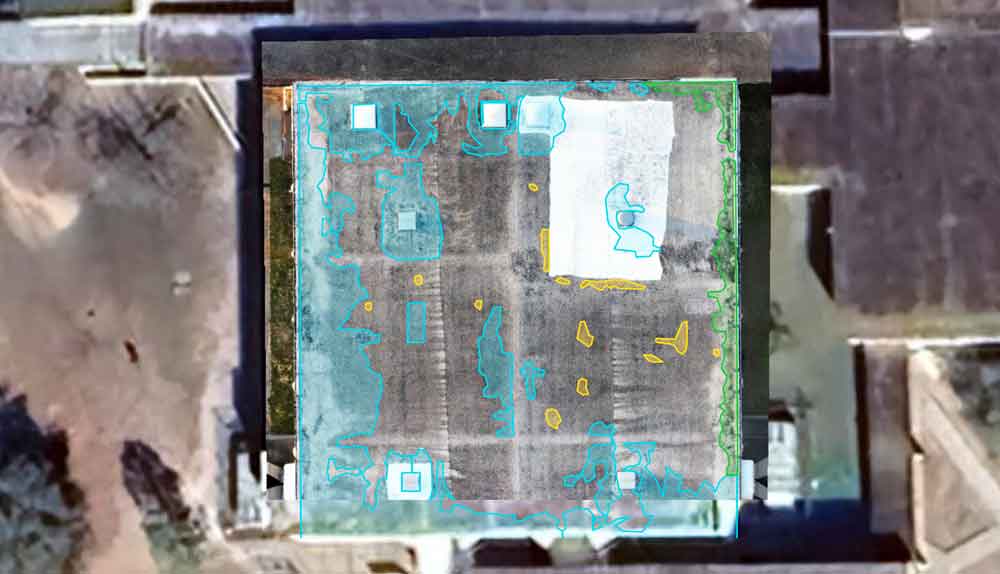
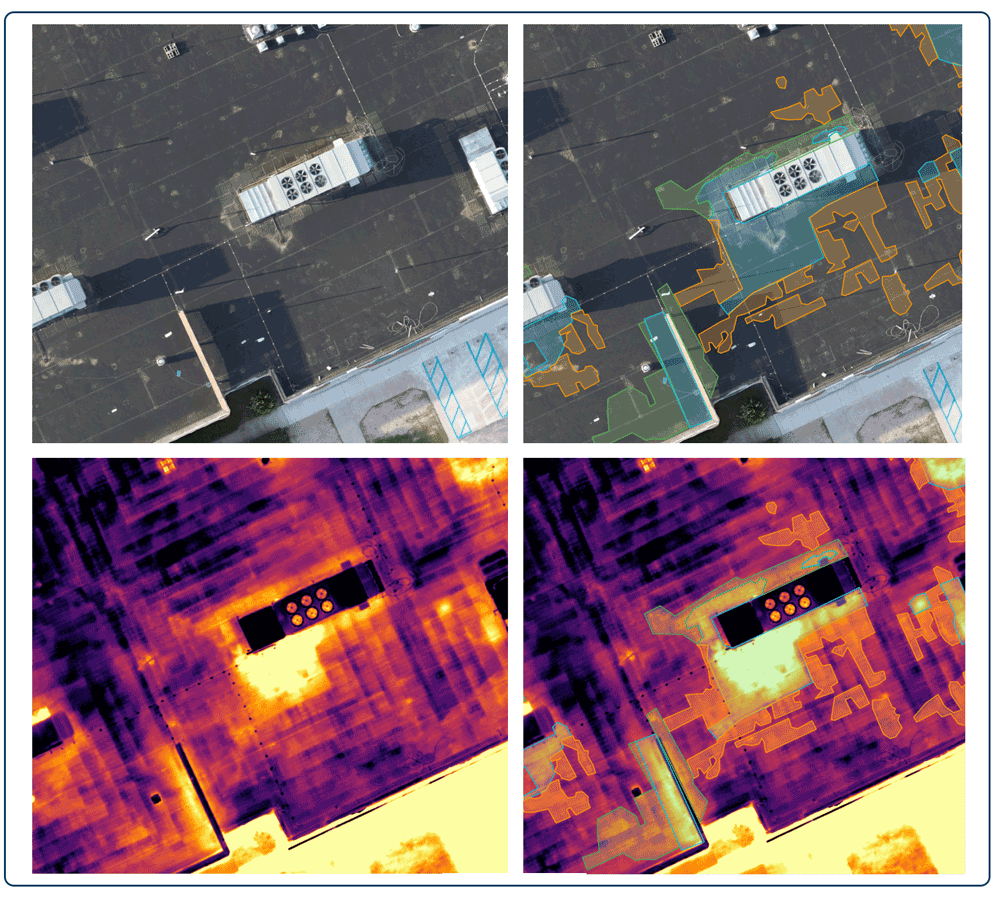
The next 20 pages of the report contain detailed visual imagery, with 11 image sets showing the visual and thermal conditions of the roof. Additionally, color-coded highlighting is used to indicate moisture intrusion within the roof system. Image Set 1 provides an overview, while the subsequent images offer close-up views showing details of various areas.
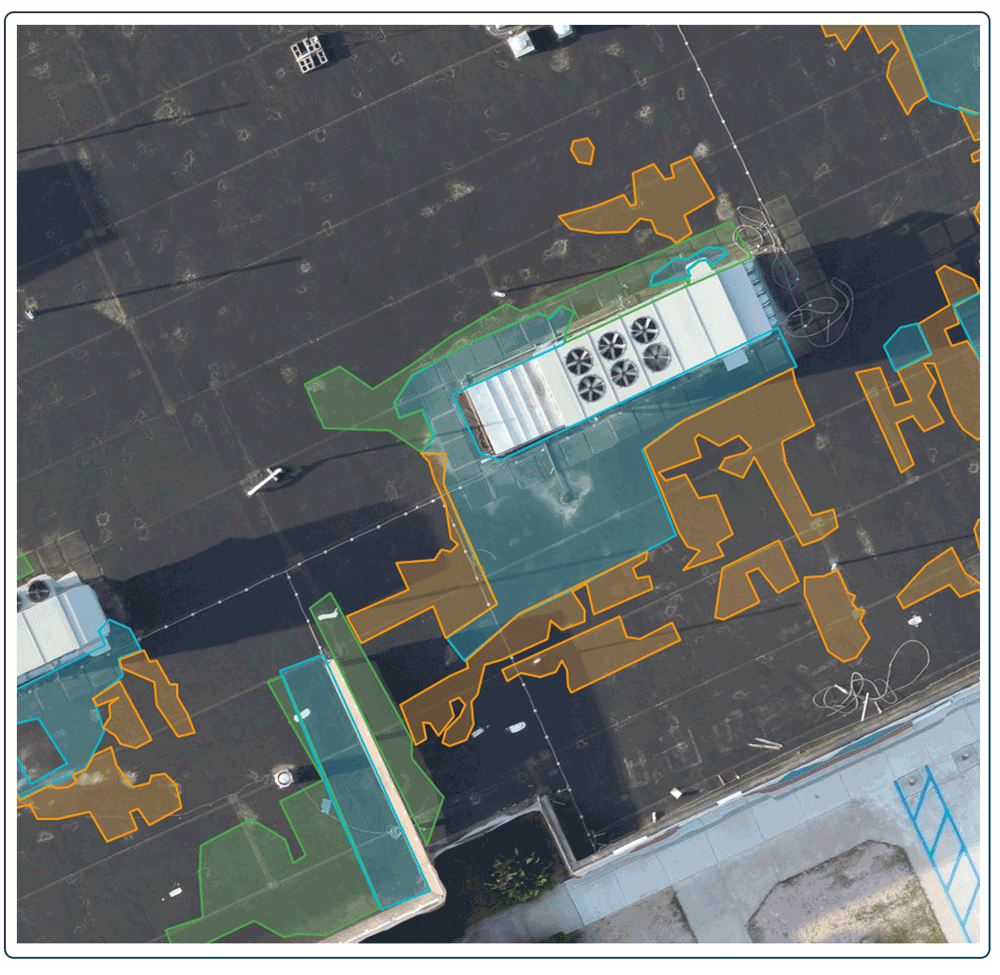
Blue highlights represent saturated moisture areas, green highlights represent high moisture areas, and orange highlights represent moderate moisture areas.
Below are sample image sets 1 and 3 which are taken from the final report.
Image Set: 1
Subject Priority: 2
Height: 150’ AGL Stitched
Image Type: Infrared/Visible
Location: Whole Roof
Equipment: DJI Matrice M30T, TRAMEX DEC Scanner
Comments: Highlighted moisture locations are represented on both thermal and visible images below.
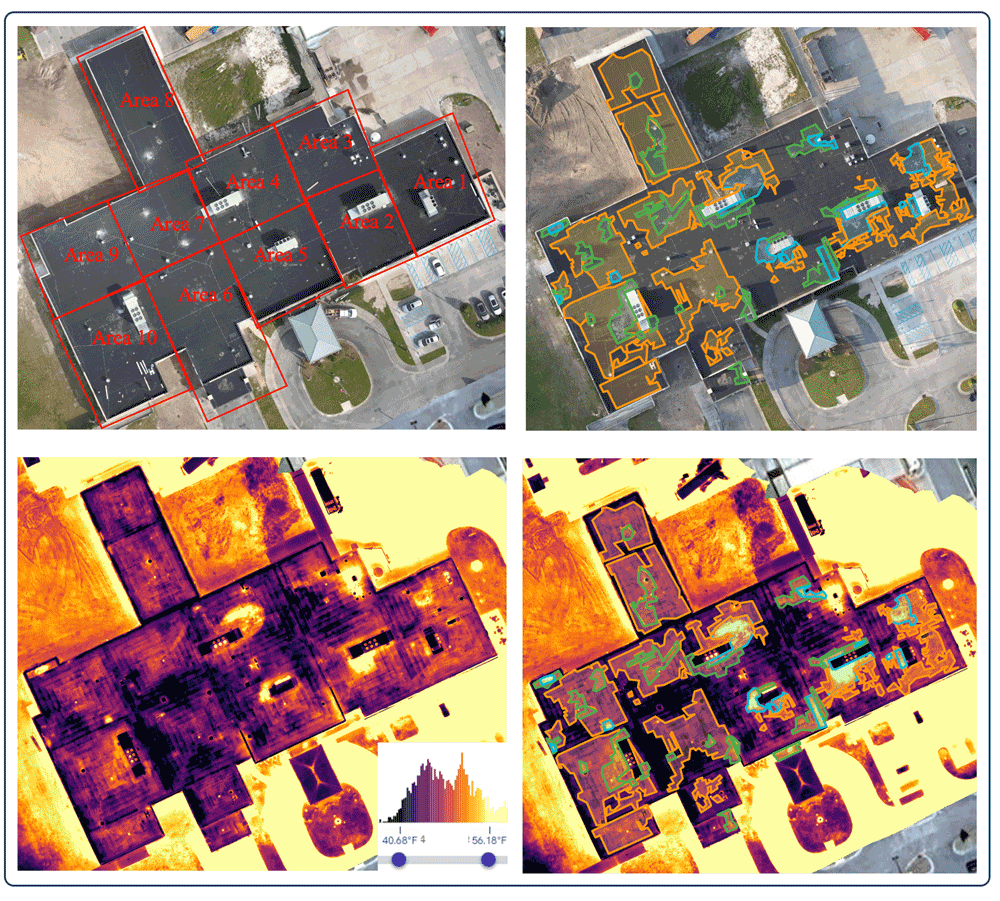
Image Set: 3
Subject Priority: 2
Height: 150’ AGL Stitched
Image Type: Infrared/Visible
Location: Area 2
Equipment: DJI Matrice M30T, TRAMEX DEC Scanner
Comments: Highlighted moisture locations are represented on both thermal and visible images below.
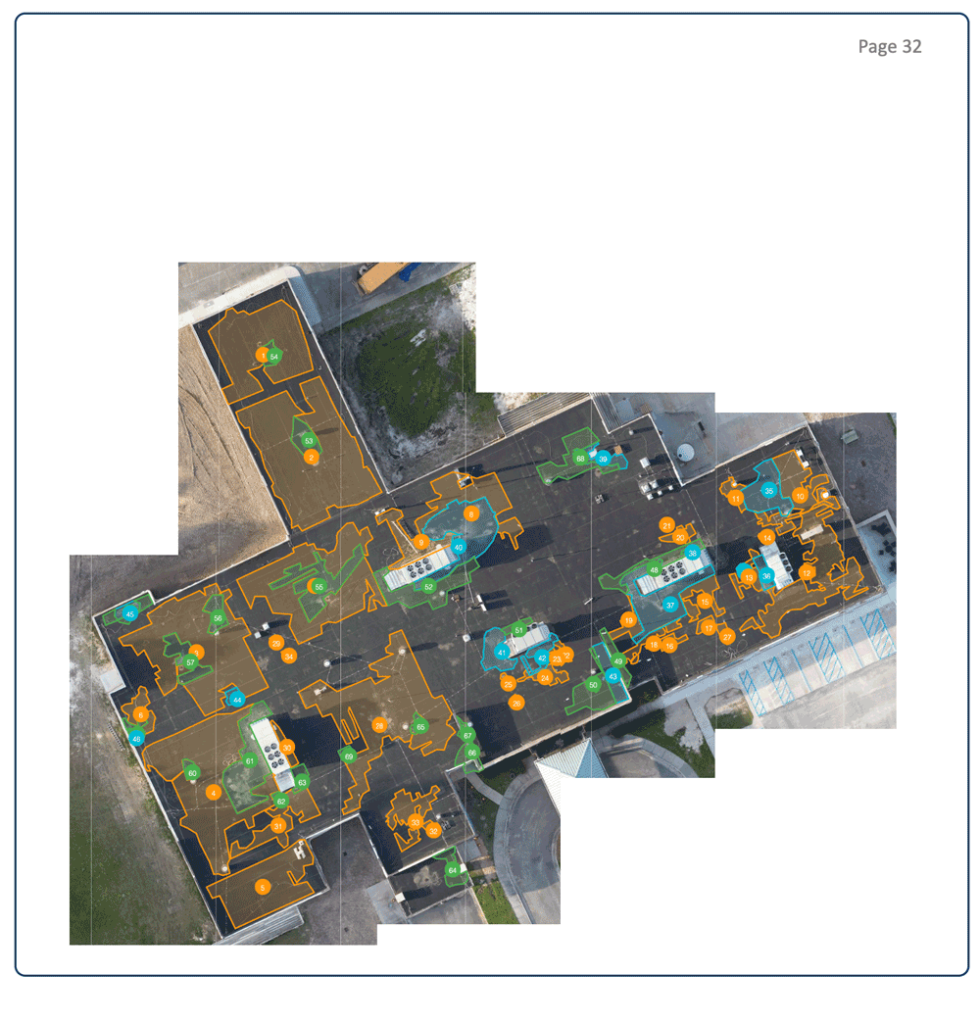
Moisture Area Details
The total roof area is 43,610 square feet with 19,285 square feet of moisture intrusion. The following 3 images show the moisture area calculations that follow use the color coding system previously described. Each intrusion is given an ID number along with a map that serves as a key showing the location of each ID number.
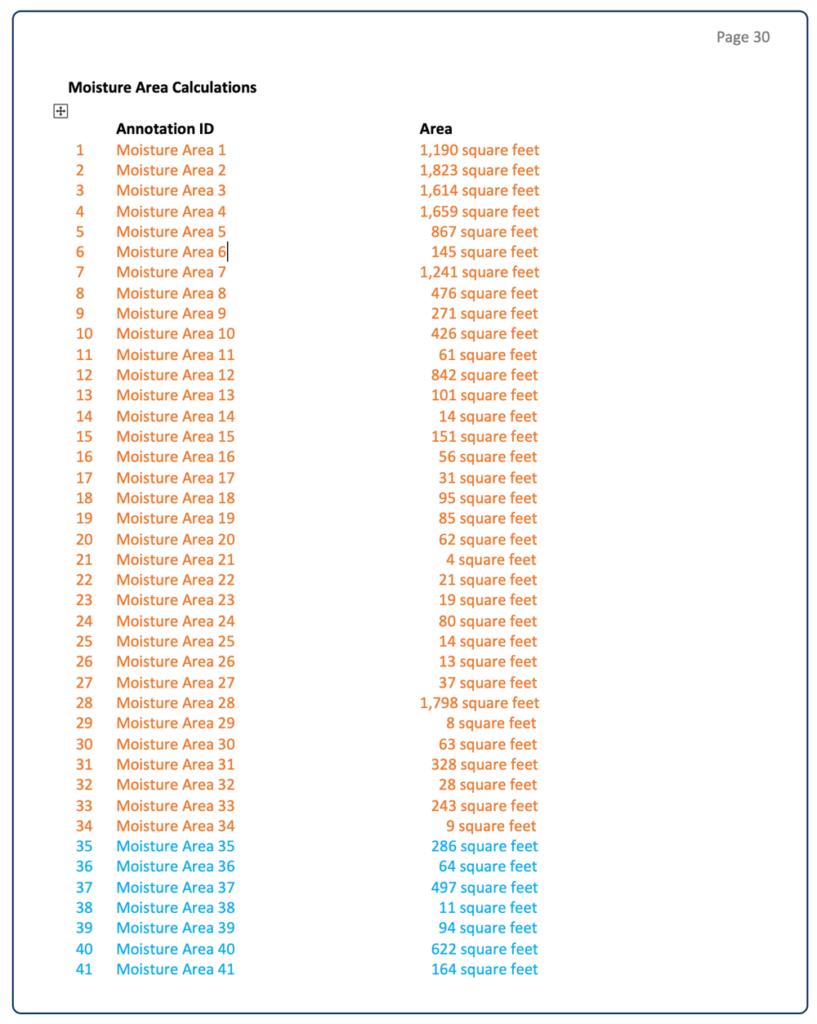
Moisture Areas by Number and Area Affected
Core Cut Details
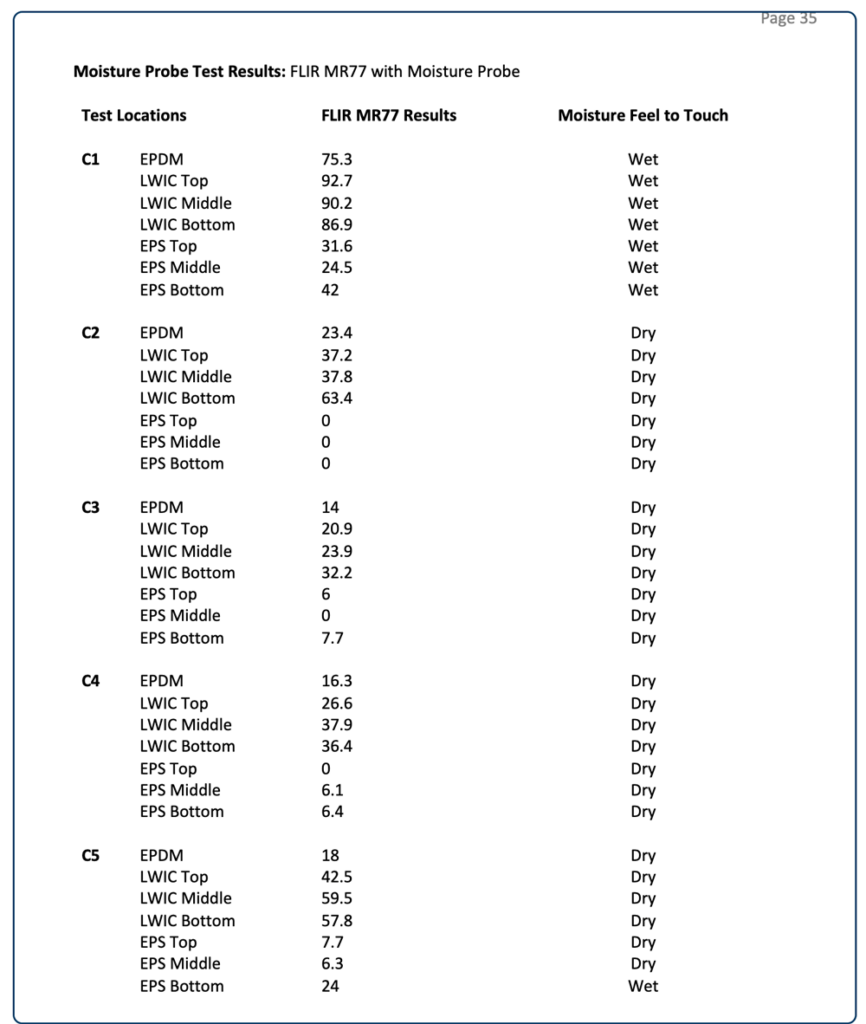
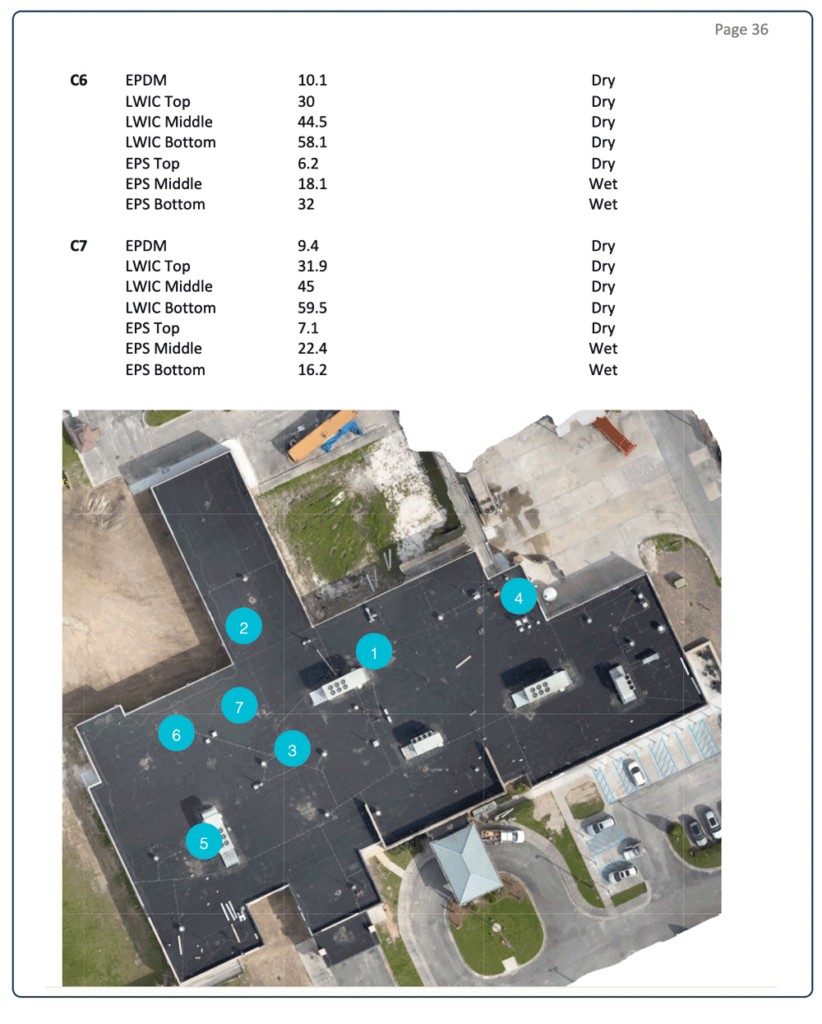
7 core cuts were taken on which the Structura View team performed electrical resistance moisture testing (moisture probe testing) to help validate suspected wet/dry locations and understand where moisture is retained within the roof’s composition. These locations were strategically selected based on the temperature data in the thermal imagery collected to help us understand the moisture content present.
- Core sample 1 reflected heavy amounts of moisture present throughout the roof’s composition as suspected.
Deck did not have any rust. - Core sample 2 reflected slightly elevated moisture readings in the lightweight insulating concrete and no moisture in the EPS, as compared to core sample 3.
Deck did not have any rust. - Core sample 3 reflected low moisture readings as suspected, giving us a dry baseline for the roof system.
Deck did not have any rust. - Core sample 4 reflected similar moisture readings as core sample 3 indicating dry results.
Deck did not have any rust. - Core sample 5 showed similar moisture results to core sample 2 in the lightweight insulating concrete and moisture was felt by touch at the bottom of the EPS insulation and reflected a higher moisture reading.
Deck did not have any rust. - Core samples 6 and 7 reflected similar moisture readings in the lightweight insulating concrete that was observed in 2 and 5. Moisture was felt by touch and reflected a higher moisture reading with the FLIR MR77 moisture meter.
Deck did not have any rust.
Where moisture was observed in the roof assembly for core samples 2, 5, 6, and 7 varied as compared to the temperature data, but all the locations did consistently reflect elevated moisture readings in the lightweight insulating concrete and/or moisture in the EPS insulation.
The moisture locations highlighted in this report have been selected based on the results of the moisture probe data and observations made from each core sample in correlation with the temperature data studied in the thermal imagery.
3 color categories have been created highlighting the varied amounts of moisture observed in the roof system.
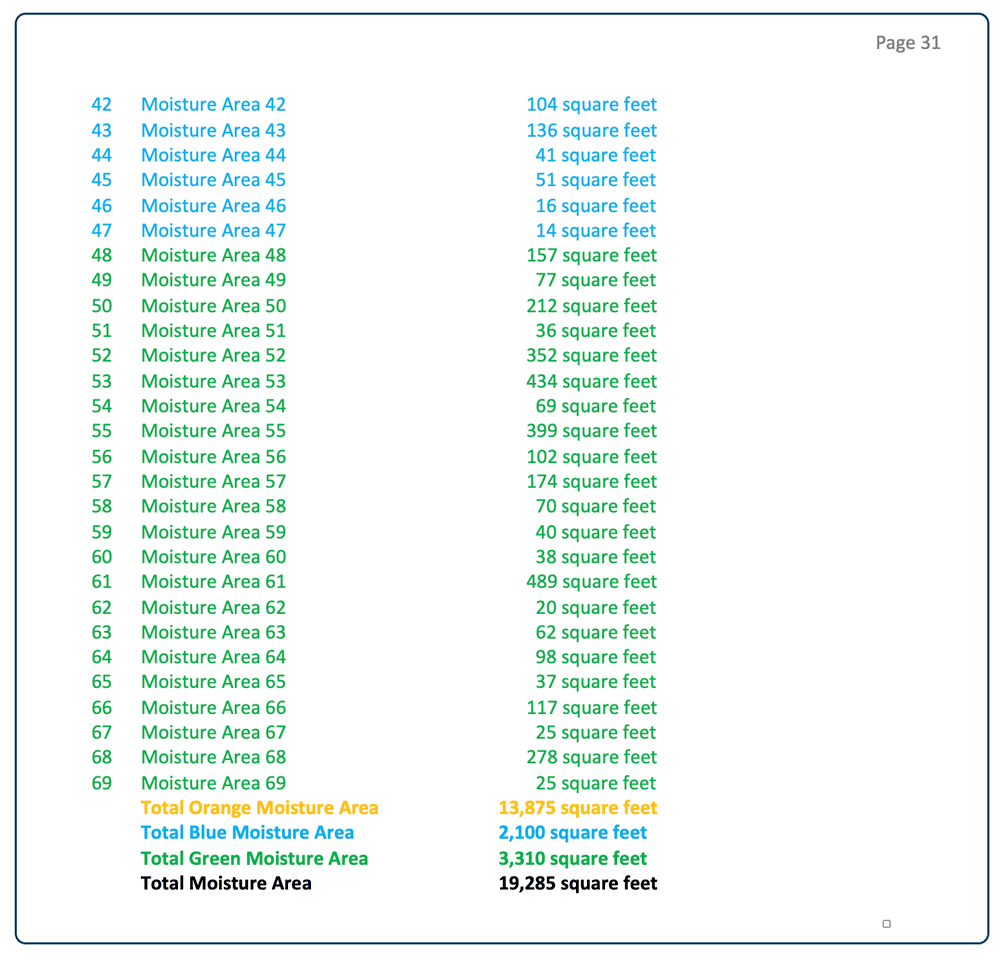
Blue highlighted areas represent portions of the roof system where heavy saturation is present in the roof system. 13 blue moisture locations were highlighted in this report totaling an estimated 2,100 square feet.
Green highlighted areas reflected higher than acceptable moisture readings in the lightweight insulating concrete. 22 green moisture locations were highlighted in this report totaling an estimated 3,310 square feet.
Orange highlighted areas reflected moderate moisture readings that were higher than the dry baseline as sampled from core location 2 and/or revealed moisture in the EPS insulation. 34 orange moisture locations were highlighted in this report totaling an estimated 14,146 square feet.
Collectively, 69 moisture locations have been highlighted totaling 19,285 square feet.
Due to not being able to perform core samples on each moisture location, the results on how much moisture is present or where that moisture is retained could vary throughout the roof system.
Supporting Images
Final Takeaways: Key Findings and Future Plans
Based on the core samples, we confirmed significant moisture intrusion in the roof, measuring just over 44%, while also noting that the metal deck was in good condition showing no signs of rust.
With insights from the report, the contractor and facility owner explored alternatives to a full roof replacement, opting for a cost-effective approach. They chose a budget-friendly strategy: fixing the moisture intrusions and applying a roof coating. This approach affordably extends the roof’s lifespan, postponing the necessity of a full replacement.