Client Challenge
The owner of the building faced recurring leaks within the premises, prompting the engagement of a local roofing company to address the issue. However, to effectively tackle the problem, the roofing contractor required comprehensive data on the condition of the roof. Recognizing the need for detailed insights into the roof’s moisture levels and overall integrity, the roofing contractor consulted with Structura View.
Our task was to conduct a thorough survey of the roof to identify underlying issues and quantify the extent of moisture intrusion. By providing accurate and actionable data, our aim was to empower the contractor to make informed decisions and devise effective solutions for his client’s roofing issues.
Roof Data
Location: Tampa, Florida
Roof Area: Estimated 9,062 Square Feet
Roof Sections: 1
Roof Composition: Modified bitumen membrane, Perlite & ISO board insulation (or fiberglass insulation in select repaired areas), over a metal deck.
Solution Strategy
Our methodology involved conducting a physical walk-through, non-destructive impedance moisture survey, electrical resistance testing on core samples, and the utilization of drone-based visual imaging to document areas where moisture was detected or observed within the roof system. Notably, thermal drone mapping was not employed during this survey.
The roof had many low areas that were darker in color and had dirt or debris build up throughout. A few of those locations have active moisture present. Many of these low areas were soft when walking over them indicating suspected degradation of the substrate.
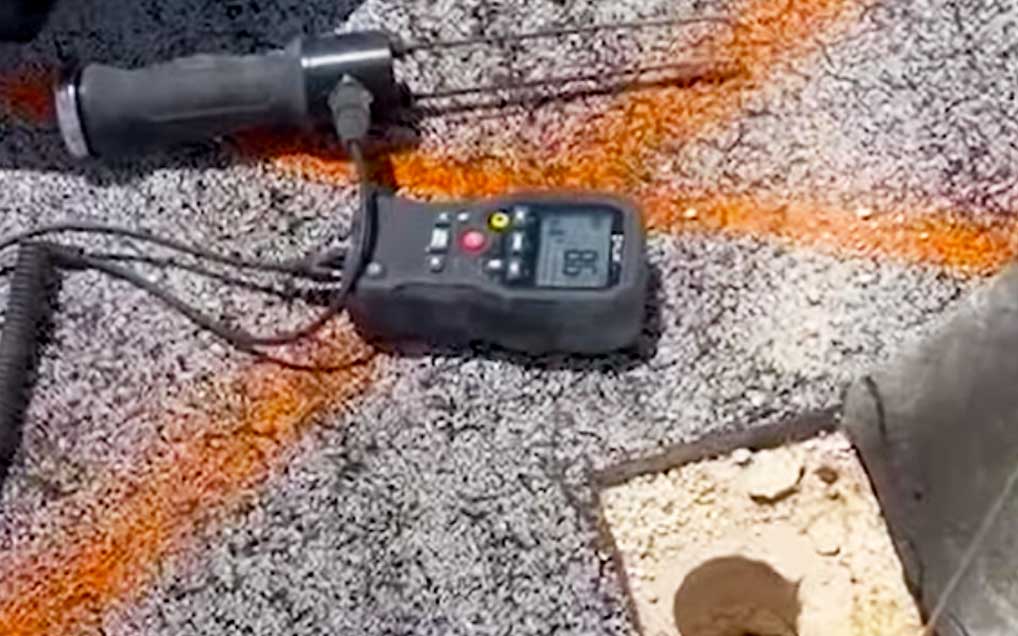
The moisture meter testing portion of the moisture survey was completed with a Tramex DEC Scanner. The DEC Scanner settings were adjusted to reflect the amount of moisture observed and tested in each core sample. For example, a DEC Scanner reading of 100 indicated full saturation, 40 indicated moderate saturation, 5% indicated light moisture and 0 indicated dry. The DEC Scanner was used to test across all the membrane laps and were marked to indicate the beginning and end of a moisture location observed in that lap.
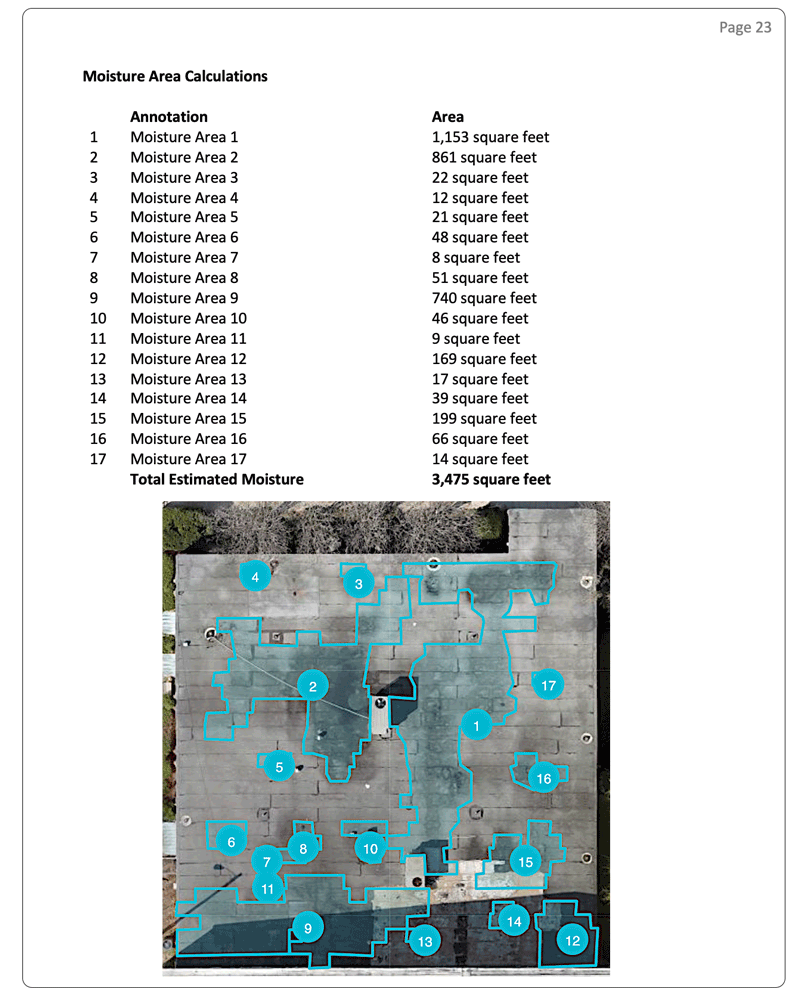
A third-party contractor performed 4 core cuts that the Structura View team performed electrical resistance moisture testing on to help validate suspected wet/dry locations, understand where moisture is retained within the roof’s composition, and document visually observed conditions. The test results of the core sample and moisture probe data are documented in detail within the report. From the data collected, 17 moisture locations have been highlighted totaling an estimated 3,475 square feet, 38%, of moisture observed in the roof system which is also documented in detail in the report.
Many of the moisture locations correlated with low spots on the roof that were darker in color and had a lot of dirt present. Some of the locations that had lower moisture content and were not correlated with these dark/ depressed areas were suspected to be newer leaks or correlated with moisture absorption at the deck. Core sample 1 reflected some rust developing on the deck. Core sample 4 was a repaired location that showed severe rusting at the deck.
Let’s Take a Look at Key Pages from the Report
The first notable page in the report is the “Roof Data Sheet”, providing a concise summary of key roof attributes. This sheet offers a high-level overview, with detailed information on aspects such as Roof Construction, Moisture Location, and Core Sample data which are elaborated in great detail further within the report.
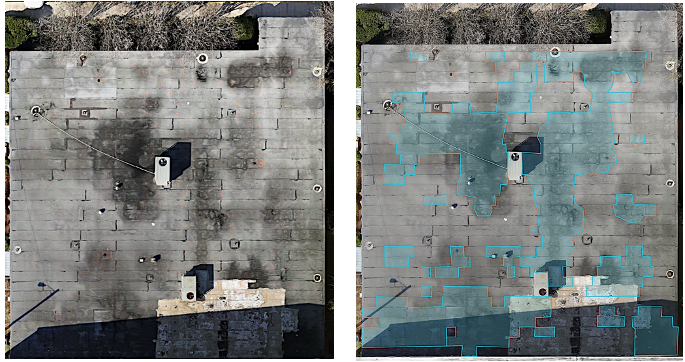
The next section of the report gives both an overview and close-up details showing visual images of the roof without any annotations along with the corresponding visual image with a moisture mapping of the validated moisture areas. Here are some sample images taken from this section of the report.
Image Set: 1
Subject Priority: 1
Height: 125’ AGL Stitched
Image Type: Visible
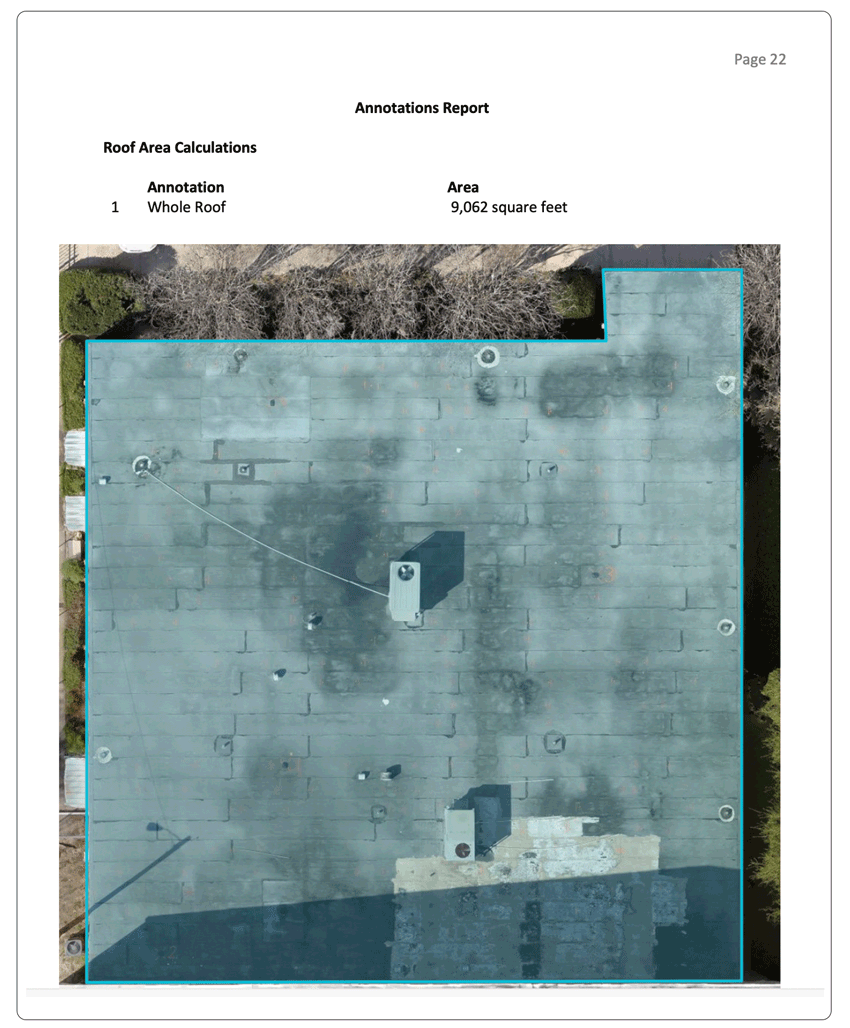
Location: Whole Roof
Equipment: DJI Matrice M30T, Tramex DEC Scanner, FLIR MR77
Comments: Highlighted moisture locations are represented on the image below.
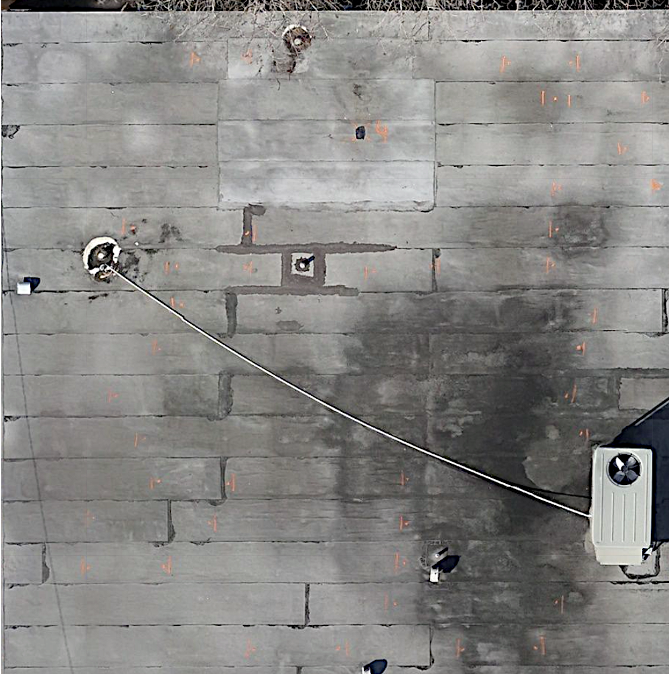
Close-Up Images
The report contains numerous additional close-up images showcasing moisture-affected areas. These images are instrumental for both the management team’s analysis and the contractor’s planning, especially in locating anomalies during on-site inspections.
Below is an example of a raw visual image without digital annotations. The orange spray-painted marks seen in this image indicate the location of core sample 4 and also show the edges where moisture was detected. These edges serve as reference points for outlining the moisture areas in both the digital report and directly on the roof.
The image below is the same as the one above, with the addition of moisture areas annotated in blue. Later in the report, each moisture area is assigned a unique ID number, along with the corresponding square footage for each identified anomaly.

Roof Area Calculations
Roof area calculations are provided in the report and help in budgeting and material procurement. While many of the roof systems we assess are very large, featuring multiple sections arranged in complex configurations, the roof in this report comprises a single section and its square footage is relatively small at approximately 9,062 square feet.
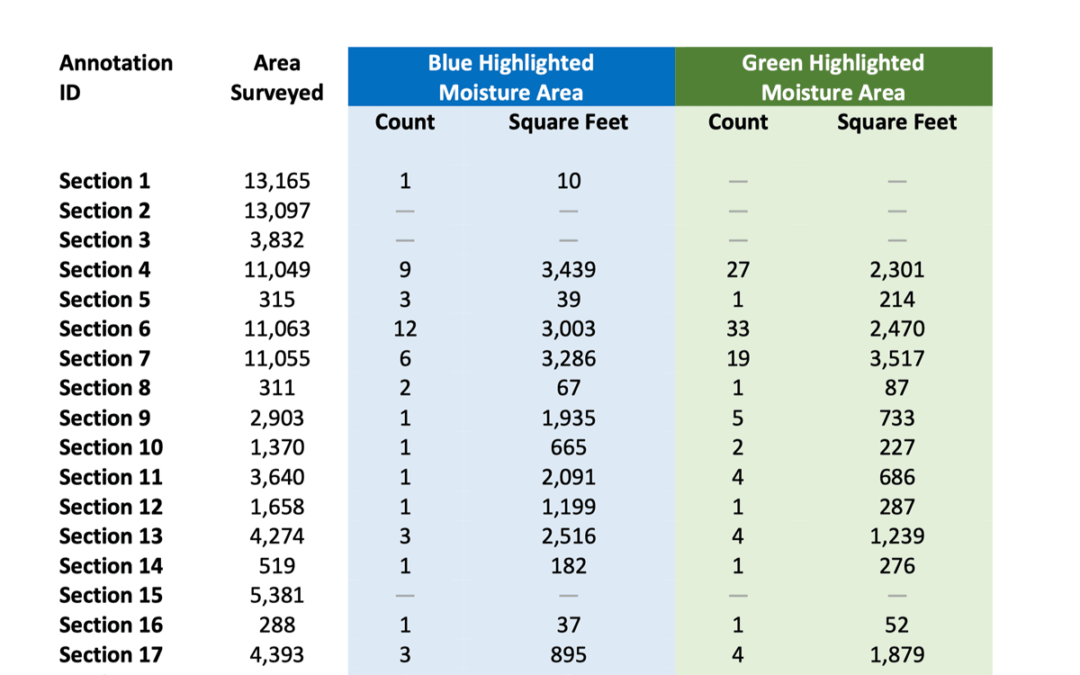
Moisture Area Calculations
The moisture area calculations serve to quantify the extent of moisture intrusion and are most accurately determined following the validation of suspected moisture areas through core samples. Below are the moisture area calculations for this roof, compiled after core sample validation.
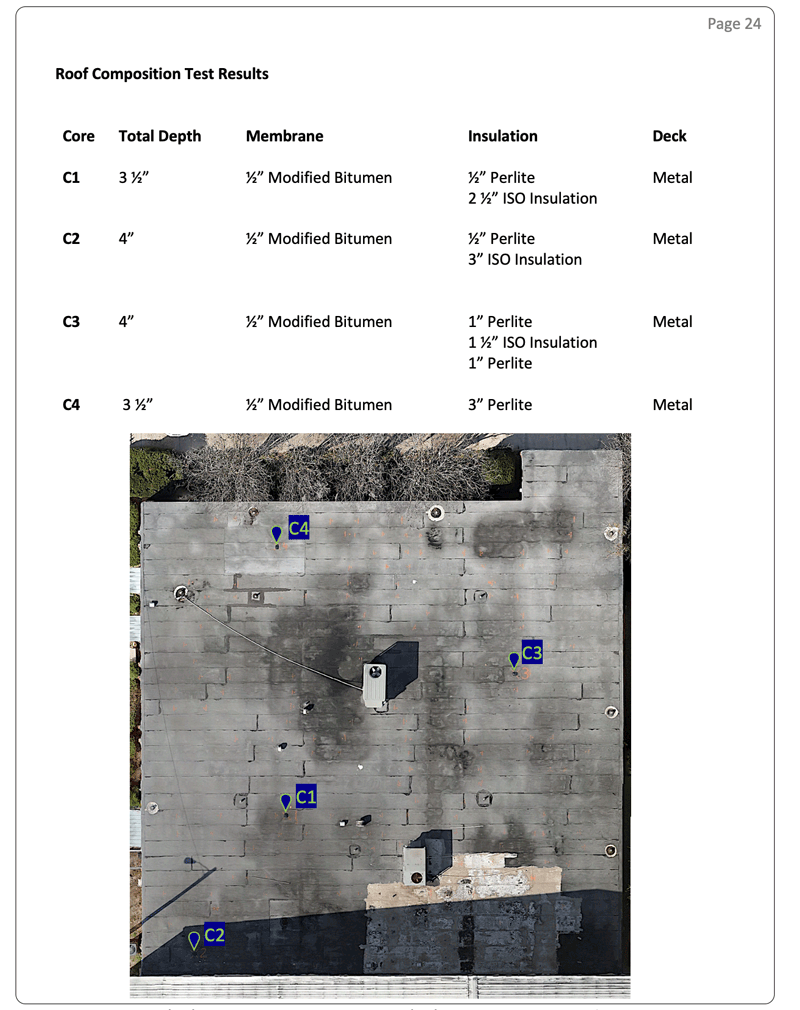
Roof Composition
Every layer of your roof serves a crucial role in ensuring protection, making it essential to evaluate each component thoroughly. While many building owners may not be aware of their roof’s composition, particularly when no issues are evident, understanding its makeup becomes important when problems arise. Following core sample analysis, we furnish comprehensive documentation detailing the roof’s composition, health status, moisture levels, and any qualitative issues such as rusting or decomposition. Presented below are the Roof Composition and Moisture Test Results for this report.
The Roof Composition Test Results outline the total depth of the roof at designated core sample locations, denoted as C1 through C4, with their corresponding positions indicated on the visual image on Page 24 below. This documentation lists the roof layers, insulation types, and deck materials used in the roof structure.
The Moisture Test Results show the moisture level detected at the top of the roof and within each layer of the roof. What we’re looking for is to verify a correlation between the DEC Scanner results to the overall moisture content for the layers taken in each core sample. So in the example below, we see the DEC Scanner results for Core 1 (C1) are 100 indicating a suspected saturated condition. We then see the MR77 results between 79–99 indicating high moisture content in the roof. We can then extrapolate that DEC Scanner results of 100 correlate to high levels of moisture in the roof.
Using the same methodology, DEC Scanner results of 40 correspond to a moderate wet area, while results of 5 and 0 correspond to light and dry areas, respectively.

To Wrap Up
Upon receiving the final report, the facility management team and the roofing contractor will review the findings in this report and together they will make recommendations on the next step. With the substantial 38% moisture intrusion detected in the roof, the roofing contractor will likely propose removing the existing roof and installing a new one.